Figure 4.

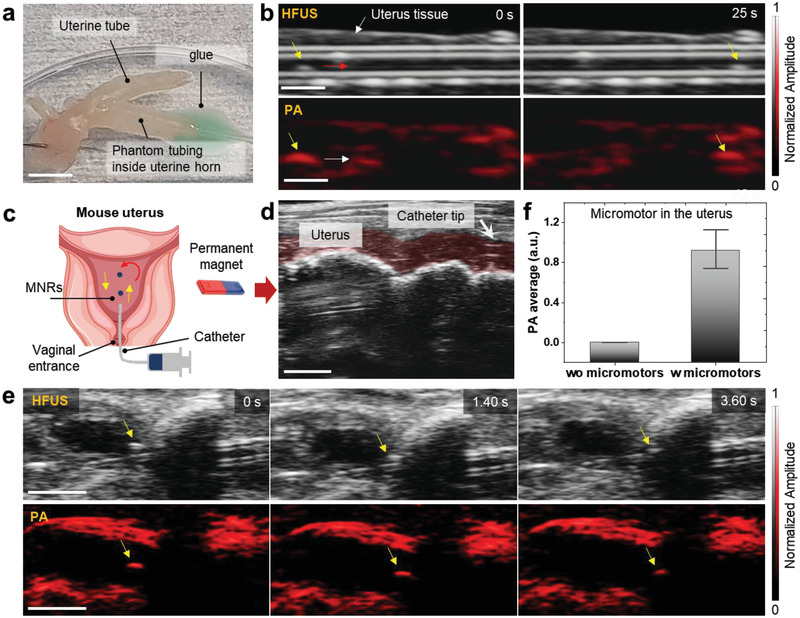
HFUS and PA imaging of micromotors in ex vivo and in vivo uterus cavity. a) The phantom tubing (with single micromotor) was inserted in an ex vivo uterine horn and glued to avoid liquid leakage. Scale bar: 5 mm. b) Precise magnetic control of a single micromotor into an ex vivo uterine horn under rotating magnetic fields (5 mT and 5 Hz) for 0 to 25 s. Scale bar: 1 mm. c) Schematic showing the insertion of the catheter into the uterus body through the vagina and moving micromotors by applying an external magnetic field. d) Real‐time HFUS feedback of positioning the catheter in the mouse's uterus. The red‐shaded area indicates the uterus channel. Scale bar: 2 mm. e) Time‐lapse images of single moving micromotors (yellow arrows show the position of moving micromotor). Scale bar: 2 mm. f) PA amplitude values extracted from the captured PA images of a single moving micromotor, compared to the control (uterus location where no micromotors were visible “wo micromotor”).
