Figure 4.

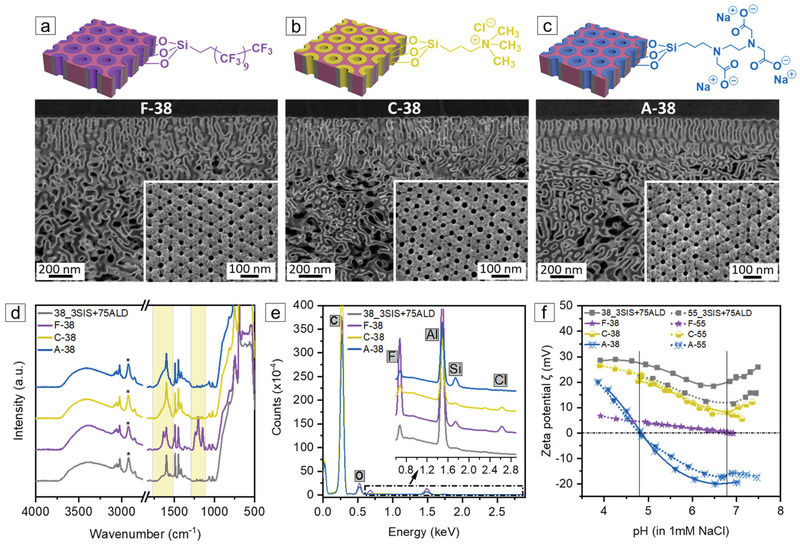
Schematic representation and SEM images of a) F‐38 (fluorinated 38_3SIS+75ALD), b) C‐38 (cationic functionalized 38_3SIS+75ALD), and c) A‐38 (anionic functionalized 38_3SIS+75ALD). d) ATR‐FTIR spectra of 38_3SIS+75ALD, F‐38, C‐38, and A‐38. The relative intensities were normalized using the characteristic CH2 stretching vibration (*) of the unreactive PS‐b‐P4VP backbone around 2924 cm−1. e) Determination of the characteristic elements fluorine (F), silicon (Si), and chlorine (Cl) by EDX along the cross‐section. f) Comparison of the surface zeta potential of two series of 3SIS+75ALD membranes before and after silanization as a function of pH.
