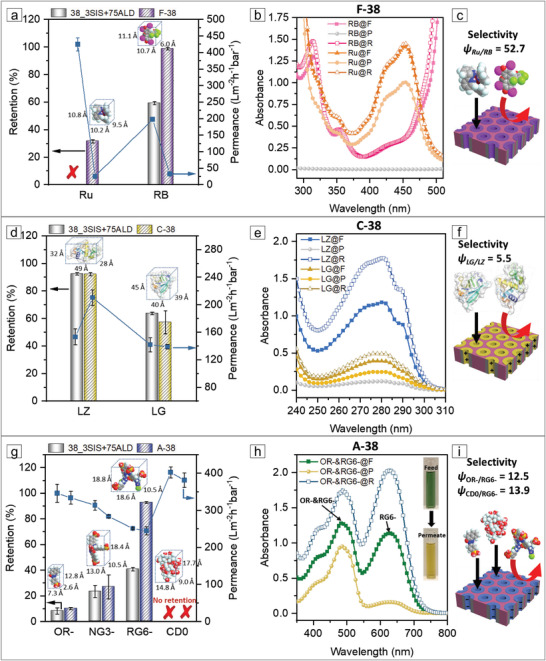
Figure 6.

a–c) Hydrophobicity‐based, d–f) charge‐based, and g–i) size/charge‐based selectivity between different organic solutes based on the fluorinated F‐38, cationic 38_3SIS+75ALD and C‐38, and anionic A‐38 membrane, respectively. a,d,g) Retention (column, left Y‐axis) and permeance (line+symbol, right Y‐axis). b,e,h) Separation behavior determined by UV–vis spectra of the corresponding feed (F), permeate (P), and retentate (R); h) a color change of the feed and permeate solution in the mixed‐solute retention of OR− and RG6−. c,f,i) Schematic representation of separation behavior.
