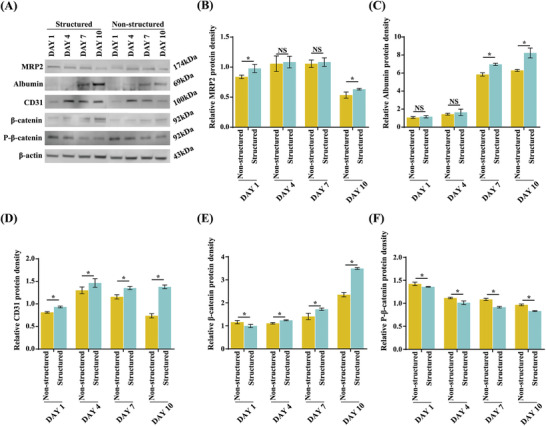
Figure 4.

Western blot analysis of the micro hepatic lobule tissue on days 1, 4, 7, and 10. A) Bands specific to MRP2, albumin, CD31, β‐catenin, and P‐β‐catenin are visualized. The β‐actin‐specific band is used as a standard. B–F) The relative band density is measured compared to that of β‐actin. The asterisks indicate a significant difference between the structured and non‐structured groups on the same day.
