
Figure 5.
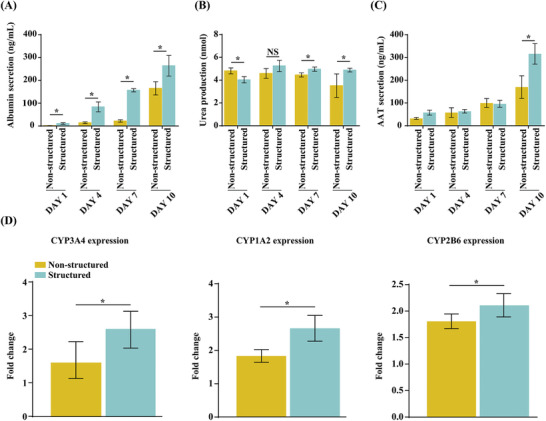
Evaluation of the hepatic function of non‐structured and structured hepatic lobules. A–C) Analysis of albumin (A), urea (B), and AAT (C) secretion using ELISA. D) CYP3A4 and CYP2B6 enzyme activity induced by rifampicin and CYP1A2 enzyme activity induced by omeprazole for 24 h. The asterisks indicate a significant difference between the structured and non‐structured groups (p < 0.05).