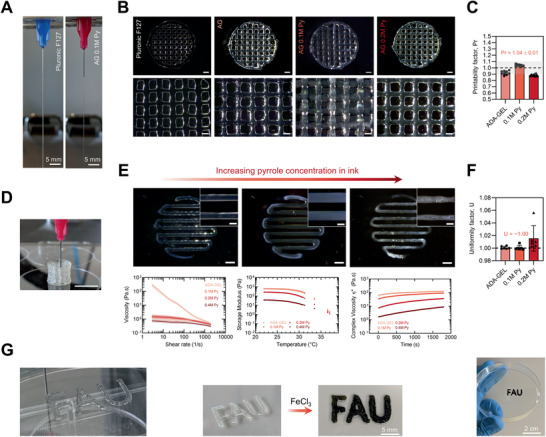
Figure 2.

Printability and rheological assessment of ADA‐GEL‐Py:PSS conductive hydrogel precursors. A) Filament formation test indicating proper gelation of the biomaterial‐ink prior to extrusion, 0.1 m Py containing ADA‐GEL, similar to Pluronic F127 40% w/v, which served as biomaterial ink control. B) Optical microscopy images of 3D‐printed 3.75% / 7.5% w/v ADA‐GEL (AG) prepared using temperature pre‐treated gelatin and 0.1 and 0.2 m Py containing modifications. Pluronic F127 (40% wt) served as benchmark ink. Scale bars: 1 mm (top), 500 µm (bottom). C) Printability factor Pr derived from the printed hydrogels, which is inversely proportional to pore‐circularity (n = 9).[ 58 ] The Pr allows an indication of pore circularity and hence printability of the biomaterial ink (Pr = 1 perfectly square pore, Pr < 1 circular pore, and Pr > 1 cluttered, over‐gelated pore) as shown elsewhere.[ 58 , 59 ] The grey region marks the range of sufficient biomaterial‐ink printability, as introduced by Ouyang and co‐workers previously.[ 58 ] D) 3D‐printed ADA‐GEL hydrogel scaffold showing a possible z‐axis height of >5 mm, used as the ADA‐GEL hydrogel basis for the 0.1 m Py and 0.2 m Py containing inks. Scale bar: 10 mm. E) Light microscopy images of one‐layer 3D‐printed ADA‐GEL, 0.1 m Py, and 0.2 m Py, and rheological analysis of Py containing ADA‐GEL. Top: ADA‐GEL and 0.1 m Py show both nearly ideal parallel struts with uniform hydrogel filaments, while 0.2 m Py indicates a non‐homogeneous strut surface. Scale bars: 1 mm, 400 µm (insets). Bottom: Shear‐rate, temperature, and time sweeps. A decrease in viscosity is shown with increasing shear‐rate, indicative for shear thinning behavior. The storage modulus (G′) of the ink decreases with temperature, indicating thermo‐sensitivity. A decrease in G′ with increasing Py molarity is visible. The complex viscosity upon cooling time (s) increases for all compositions, while a drop in complex viscosity η* is shown for ADA‐GEL‐Py compositions >0.1 m Py. F) Hydrogel strut uniformity factor U [ 59 , 60 ] indicating the smoothness of deposited hydrogel struts, which is derived as the strut length in image‐width divided by the theoretical strut length. U = 1 depicts an ideally uniform strut (dashed horizontal line).[ 59 , 60 ] Non‐uniformity of 0.2 m Py is reflected in a higher standard deviation of U in comparison to ADA‐GEL and 0.1 m Py (n = 6). Data are shown as mean ± SD. G) Photographs of 3D‐printed CAD model letters before (left) and after (right) oxidiation of Py to form PPy using FeCl3.
