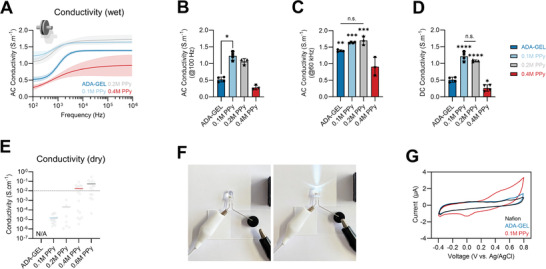
Figure 3.

Electrical properties of ADA‐GEL‐PPy:PSS hydrogel. A) EIS of wet ADA‐GEL and ADA‐GEL‐PPy:PSS hydrogels synthesized using 0.1, 0.2, and 0.4 m Py inside ADA‐GEL during oxidation to form PPy. Samples are denoted as 0.1 m PPy, 0.2 m PPy, and 0.4 m PPy. Data are shown as mean curves and SD interval of confidence (n ≤ 4). For low (≈100 Hz) and high (>1 kHz) frequencies, enhanced electrical conductivity is visible for the 0.1 and 0.2 m PPy modifications. B) Corresponding readouts of AC conductivity of the hydrogels at 100 Hz and C) 60 kHz, with a significant increase in AC conductivity at 100 Hz observed for 0.1 m PPy hydrogels. Data are shown as mean ± SD. D) DC conductivity indicating a significant increase in conductivity for 0.1 and 0.2 m PPy (****p < 0.0001) in comparison to pristine ADA‐GEL. Data are shown as mean ± SD. Significant differences of means were analyzed using one‐way ANOVA analysis followed by post‐hoc Bonferroni test (*p < 0.05, **p < 0.01, ***p < 0.001). E) Electrical conductivity of freeze‐dried ADA‐GEL and PPy‐modified ADA‐GEL assessed via four‐point probe measurements (dry samples). While no conductivity could be measured using unmodified ADA‐GEL (N/A), an increase in conductivity was observed with increasing Py content during PPy oxidation. Data are shown as median (colored horizontal) and individual data points (gray dots). F) Light microscopy images of a DC 9V circuit conducted using ADA‐GEL‐PPy:PSS hydrogel to light an LED. G) Cyclic voltammetry measurement of ADA‐GEL and ADA‐GEL‐PPy:PSS (0.1 m Py) modification indicating electrical redox activity of the PPy modified hydrogel.
