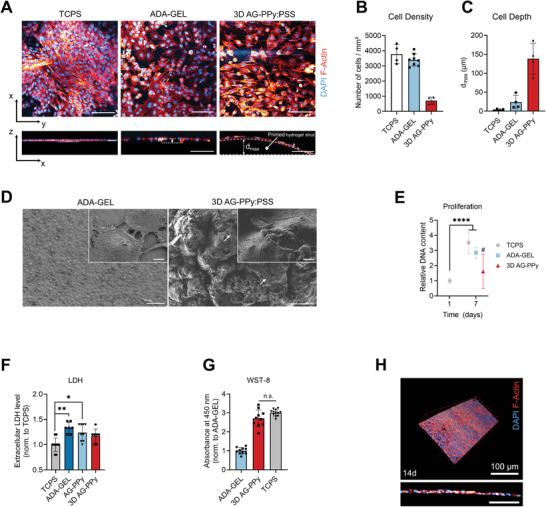
Figure 5.

Cytocompatibility study of 3D AG‐PPyhydrogels. A) Multiphoton fluorescence microscopy images of ATDC‐5 cells (Nuclei, DAPI, blue; F‐Actin, Rhodamine Phalloidin, red) grown for seven days on tissue culture polystyrene (TCPS), mTG‐Ca2+ crosslinked ADA‐GEL (ADA‐GEL), and 3D AG‐PPy hydrogels. Bottom: x–z projections of z‐stacks. Scale bars: 100 µm. B) Quantification of the number of cells on each substrate (n = 4). C) Analysis of the depth d max in which cells were found on the hydrogels (cell depth) as a measure of seeding depth and seeding efficiency on the hydrogel scaffolds. D) SEM micrographs of ATDC‐5 cells grown for seven days on the substrates. Cell–material and cell–cell interaction are visible on both materials. Scale bars: 100 µm (left), 50 (right), 4 µm (insets). E) Proliferation study of ATDC‐5 on TCPS, ADA‐GEL, and 3D AG‐PPy. DNA content (dsDNA) after seven days is shown relative to ATDC‐5 cells grown on TCPS for 24 h, which served as control for all samples, and is quantified via PicoGreen assay (n = 4). Data are shown as mean ± SD. ****p < 0.0001, #n.s., relative to control (one‐way ANOVA with Bonferroni post‐hoc test). F) Quantification of extracellular LDH (n ≥ 7) after 24 h of cell culture to detect initial material cytotoxicity. Data are shown as mean ± SD and normalized to the TCPS samples. Statistically significant differences of mean ranks (*p < 0.05, **p < 0.005) were determined by non‐parametric Kruskal–Wallis followed by Dunn's multiple comparisons test. G) Cell viability WST‐8 assay (n ≥ 5) of ATDC‐5 cells on the different substrates, normalized to the ADA‐GEL hydrogel reference. No significant difference (n.s., Student's t‐test) was observed between 3D AG‐PPy samples and the TCPS control. H) ATDC‐5 cells grown for 14 days on ADA‐GEL positive reference. A confluent and dense cell layer is reached on the material.
