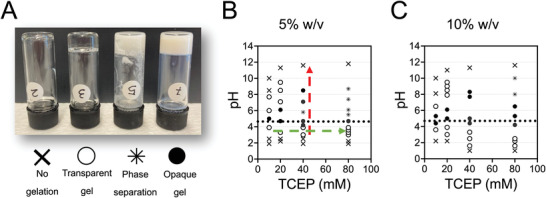
Figure 1.

TCEP‐pH phase diagrams for BSA gelation at room temperature. A) Photographs of BSA solutions exhibiting four different conditions. From left to right: no gelation of solution, transparent gel, phase separation, and opaque gel. The distinction between opaque and transparent gels was made based on the ability to clearly see an object through the gel. B,C) Phase diagrams for (B) 5% and 10% (C) BSA solutions with pH on the y‐axis and TCEP concentration on the x‐axis constructed on the base of conditions presented in (A). Dotted line at pH 4.7 corresponds to the isoelectric point of BSA. Red and green dashed arrows are a guide to the eye to aid the discussion in the text.
