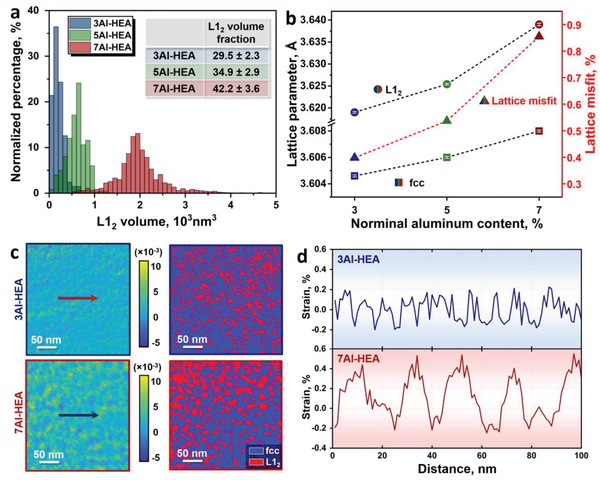
Figure 4.

Statistic volume distribution of the L12 nanoprecipitates and quantitative lattice misfit and lattice strain in the HEAs. a) Normalized percentage with respect to the single precipitate volume, the inset shows the overall volume fractions of L12 precipitates. b) Lattice parameter and lattice misfit of the L12 and fcc phases. The lattice misfit (ε) is calculated using the equation ε = 2(a L12 − afcc )/(a L12 + afcc ), where a L12 and afcc are the lattice parameters of the L12 and fcc phases, respectively.[ 36 ] c) Local strain distribution map and corresponding phase distribution map of the 3Al‐HEA and 7Al‐HEA. d) 1D strain distributions along the arrows in (c).
