Figure 4.

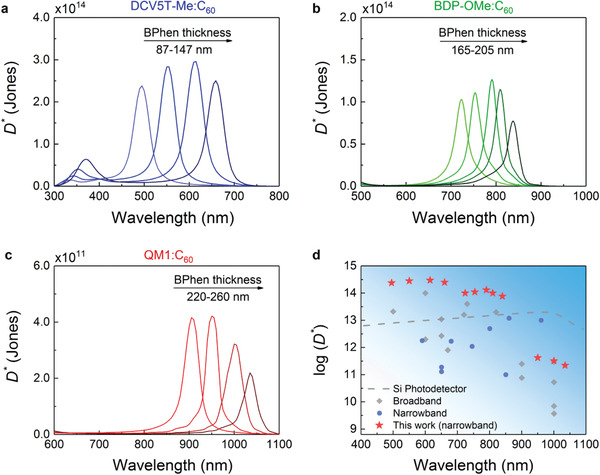
Specific detectivity spectra of TC‐OPDs and performance comparison. D * spectra of TC‐OPDs at zero bias with varied spacer (BPhen) layer thicknesses based on different active blends a) DCV5T‐Me:C60, b) BDP‐OMe:C60, and c) QM1:C60, respectively. d) Comparison of D * as a function of wavelength from previously reported photodetectors.[ 11 , 13 , 15 , 18 , 22 , 27 , 38 , 39 , 40 , 41 , 42 , 43 , 44 , 45 , 46 , 47 , 48 , 49 , 50 , 51 ] The performance values of the photodetectors from the literature are listed in Table S3, Supporting Information.
