
Figure 2.
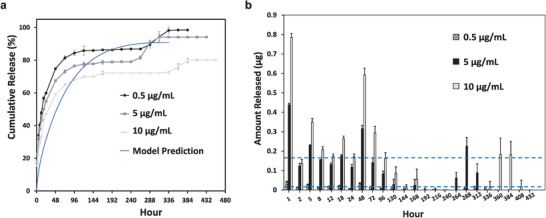
Release kinetics of 10 kDa FITC‐dextran payload from synthetic hydrogels submerged in 1× phosphate buffered saline solution (PBS) at 37 °C for initial loading concentrations of 0.5, 5, and 10 µg mL−1. a) Comparison of cumulative release over time for different hydrogel payload concentrations and predicted cumulative release profile from the computational model based on Fickian diffusion and hydrogel degradation. b) Total amount of FITC‐dextran released over time from hydrogels for each loading concentration. All data are expressed as mean ± SD (n = 4). Blue dashed lines correspond to thresholds of 0.01 and 0.16 µg.