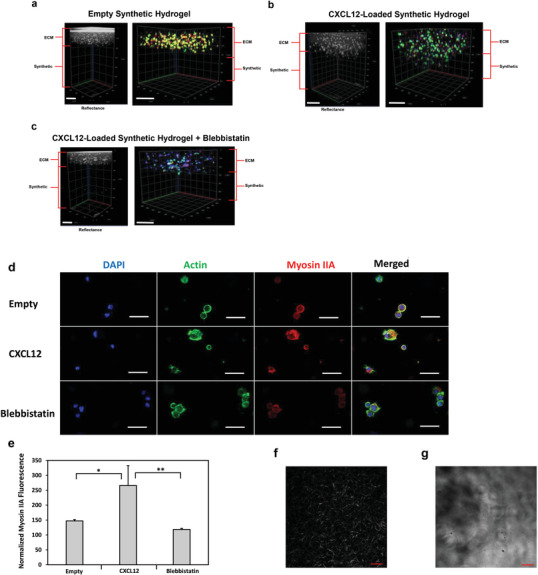
Figure 6.

Mechanism of U251 GBM invasion into synthetic hydrogel from collagen‐HA hydrogel layer. Either empty or 5 µg mL−1 CXCL12‐loaded synthetic hydrogels were synthesized in PDMS molds as the bottom layer. On the top layer, collagen‐HA hydrogels were synthesized encapsulating U251 GBM cells at 1 × 10⁶ cells/mL. After 14 h, reflectance confocal z‐stack imaging at 640 nm was used to demarcate the two hydrogel layers. Blue is DAPI, green is actin filament staining, and red is myosin IIA. Cell invasion in response to a) empty synthetic hydrogels, b) CXCL12‐loaded synthetic hydrogels, and c) CXCL12‐loaded synthetic hydrogels subjected to 30 µm of (‐)‐blebbistatin incubation. Scale bars represent 200 µm. d) Representative 1.61 µm optical slice images of the cells in the collagen‐HA layer for each corresponding sample group. Scale bars represent 50 µm. e) Quantification of normalized myosin IIA fluorescence intensities based on three cells from five representative images in the collagen‐HA layer with a confocal microscope at 20×. Data shown are mean ± SD (n = 3) by one way ANOVA and Tukey's post‐hoc analysis. No background invasion for empty synthetic hydrogels or blebbistatin‐treated samples was observed. *p‐value < 0.05, **p‐value < 0.01. f) Representative second harmonic generation image of U251 GBM‐encapsulated collagen‐HA hydrogel after 24 h of culture. Scale bar is 50 µm. g) Representative reflectance (543 nm) image of synthetic hydrogel swelled for 24 h in PBS at 37 °C. Scale bar is 50 µm.
