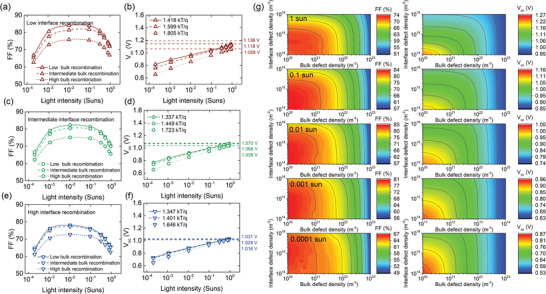
Figure 5.

Simulated results for FF and V oc of PSCs with front side illumination under different light intensities. a,c,e) –FF and b,d,f) −V oc of the simulated devices with fixed series and shunt resistance (67.82 Ω, and 1.335 × 10⁷ Ω, respectively), and varied interface and bulk defect densities responsible for bulk and interface recombination. Here the bulk defect densities of 1020 m–3, 1021 m–3, and 1022 m–3 represent the cases of the low, medium, and high bulk recombination, respectively. The interface defect density of 5.0 × 10¹⁴ m–3, 2.5 × 10¹⁵ m–3, and 1.0 × 10¹⁶ m–3 represent the cases of the low, medium, and high interface recombination respectively. g) 3D graphs of light‐intensity‐dependent FF and V oc in the PSC with front illumination considering different levels of bulk and interface defect densities, responsible for bulk and interface recombination.
