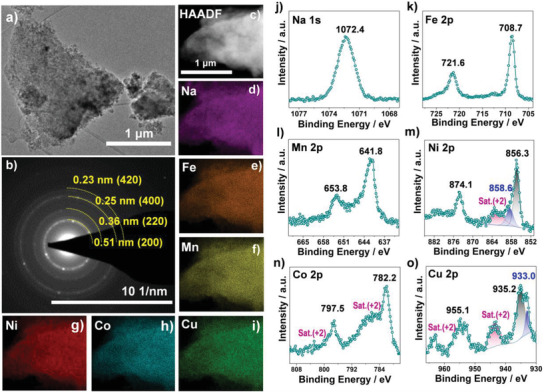
Figure 2.

a) TEM image, b) SAED pattern, c) HAADF STEM image, and d–i) the corresponding EDS maps for Na (in purple), Fe (in orange), Mn (in yellow), Ni (in red), Co (in cyan), and Cu (in green) for HE‐PBA. j) Na 1s, k) Fe 2p, l) Mn 2p, m) Ni 2p, n) Co 2p, and o) Cu 2p XP core‐level spectra for HE‐PBA.
