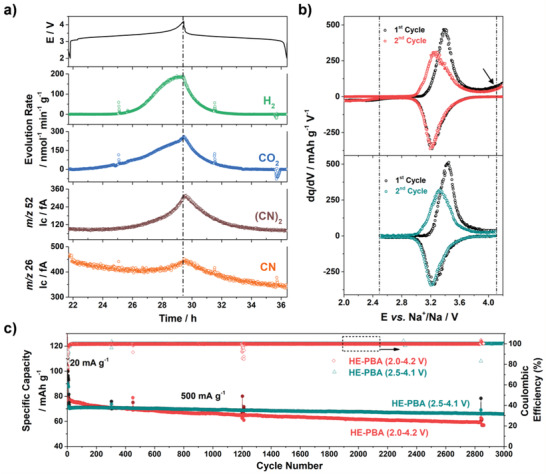
Figure 7.

a) Gassing behavior of the HE‐PBA cathode during de/sodiation in the 2nd cycle from in situ DEMS. Evolution rates of H2 (green) and CO2 (blue) and ion currents for m/z = 52 (brown) and 26 (orange) are shown. b,c) Comparison of the cyclability of HE‐PBA in different voltage ranges: 2.0–4.2 V (in red/black) and 2.5–4.1 V (in cyan/black). b) Differential capacity plots of the first two cycles. c) Long‐term cycling performance at 0.5 A g−1 after 5 cycles at 0.02 A g−1.
