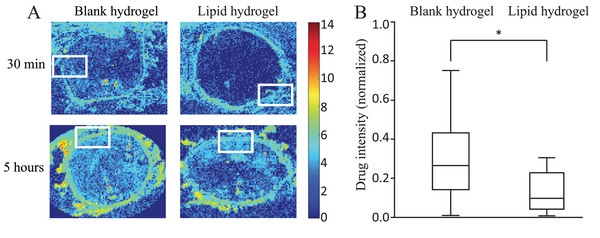
Figure 5.

MALDI‐MS images show the Everolimus distribution in the arterial wall behind the lipid‐free and lipid‐rich hydrogels after 30 min and 5 h of perfusion. The rectangles indicate the location of the hydrogels as obtained from images with HE staining (not shown) (A). The Rainbow scale shows an Ln scale of the total ion count for Everolimus. Analysis shows a difference between normalized Everolimus intensities in arterial wall regions behind the lipid‐free and lipid‐rich hydrogel. Intensities in the arterial wall behind the lipid‐rich and lipid‐free hydrogel were normalized against the maximum intensity in the corresponding MALDI images, which was found in the tunica media (excluding stent struts) not covered by the hydrogel. The variations in normalized intensity behind the blank hydrogel run between 0.01 and 0.75. The absolute intensities behind the lipid‐rich hydrogel are lower, so are the variations, which run from 0.01 to 0.31. Data are given as a boxplot illustrating the median and interquartile range, with the ends of the whiskers indicating the minimum and maximum observed values. Data are combined for all perfusions between 30 min and 5 h (n = 80 ROIs for blank and n = 80 ROIs for lipid‐rich) (B). * = p < 0.05
