Figure 2.

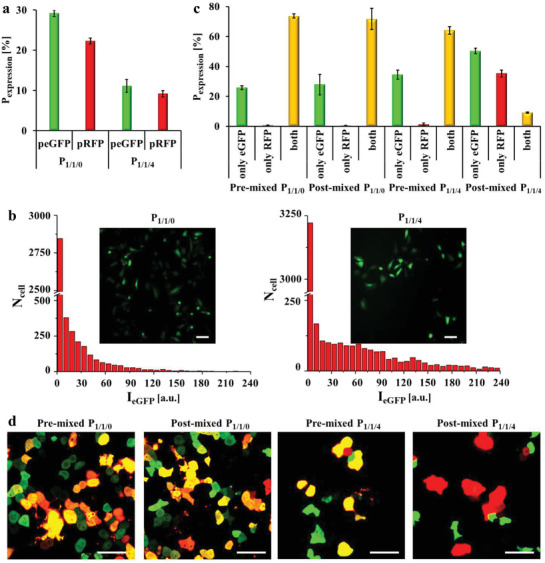
Dual delivery of pre‐mixed and post‐mixed P 1/1/0 and P 1/1/4 polyplexes to HeLa cells using enhanced green fluorescent protein (eGFP)‐encoding plasmid (peGFP) and red fluorescent protein (RFP)‐encoding plasmid (pRFP) as reporting genes. Cells were incubated with polyplexes at 1.4 µg mL−1 DNA in serum free cell culture medium for t = 3 h, followed by further culture in fresh 10% FBS supplemented cell culture medium without polyplexes for t′ = 24 h. The cells were imaged by confocal laser scanning microscopy (CLSM), and the fraction of fluorescent cells was calculated. The transfection efficiency P expression is thus given in terms of percentage of cells expressing eGFP or RFP. a) Only one type of plasmid (i.e., peGFP or pRFP) was added to the respective cell cultures. b) Distributions of eGFP fluorescence intensity (denoted as I eGFP) transfected by P 1/1/4 or P 1/1/0 using peGFP. N cell is the total amount of cells measured from the images. Insert images are cells expressing eGFP. Scale bars represent 50 µm. c,d) Dual delivery of peGFP and pRFP using pre‐mixed or post‐mixed polyplexes. For pre‐mixed polyplexes the two plasmids (i.e., peGFP or pRFP) were mixed first, and PEI was added later. For post‐mixed polyplexes, polyplexes containing one type of plasmid were prepared first, and the two types of polyplexes carrying different plasmids were mixed later. In each polyplex particle, pre‐mixed polyplexes contained two types of plasmids, whereas post‐mixed polyplexes contained only one type of plasmid. The two plasmids were mixed at 1:1 mass ratio. c) Percentage of cells expressing only eGFP, only RFP, and both in successfully transfected cells. d) Images of eGFP (shown in green) and RFP (red) expressing cells measured by CLSM. Cells expressing both proteins are shown in yellow. The scale bars represent 50 µm.
