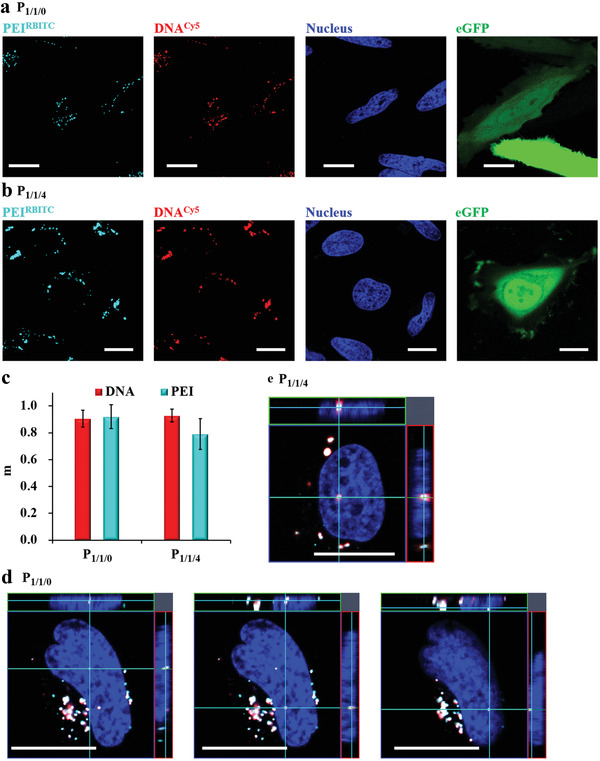
Figure 6.

Dissociation and nuclear entry of P 1/1/0 and P 1/1/4 polyplexes in eGFP expressing cells. a,b) Polyplexes were prepared from fluorescence labeled PEIRBITC and DNACy5. HeLa cells were incubated with a) P 1/1/0 and b) P 1/1/4 polyplexes at 1.4 µg mL−1 DNACy5 in serum free culture medium for t = 3 h, followed by further culture in fresh 10% FBS supplemented cell culture medium without polyplexes for t′ = 24 h. In the fluorescence images PEIRBITC is shown in cyan, DNACy5 is shown in red, eGFP is shown in green, and nuclei stained with Hoechst 33342 are shown in the blue fluorescence channel. The scale bars represent 20 µm. c) Overlap degree of PEIRBITC (cyan) and DNACy5 (red) calculated by pixel intensity. Red bars show Manders' coefficient m 1 (DNACy5), the percentage of red fluorescent pixels overlapping with cyan fluorescent pixels. Cyan bars show Manders' coefficient m 2 (PEIRBITC), the percentage of cyan fluorescent pixels overlapping with red fluorescent pixels. N = 21 and 18 cells were analyzed for P 1/1/0 and P 1/1/4, respectively. d,e) Orthogonal views of intranuclear condensed d) P 1/1/0 and e) P 1/1/4 polyplexes in eGFP expressing cells after t′ = 24 h. The scale bars represent 20 µm. Additional data are shown Figure S1.4.3.1, Supporting Information.
