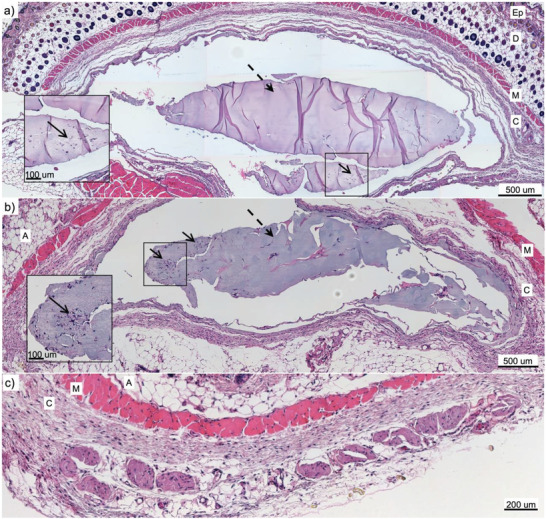
Figure 5.

Histological assessment of the skin tissues surrounding the hydrogel implants (local inflammation response) 14 days after administration. Results are presented for both PF‐A and PF‐A + AuNPs groups. Cell nuclei are stained in blue (Hoechst 33258); macrophages are stained in green (F4/80 marker). The skin of CD‐1‐infected mice was used as a positive control, whereas the skin from the opposite flank of the experimental mice was used as a negative control. White ovals mark the cavities left by the fragile hydrogel volumes. The right side is a superposition of blue and green fluorescent signals on bright field optical microscopy [note: mosaics were reconstituted with several bright field images, which left geometrical patterns in the process (image artifact)]. The thickness of each slice was 20 µm, and the scale bar is 500 µm.
