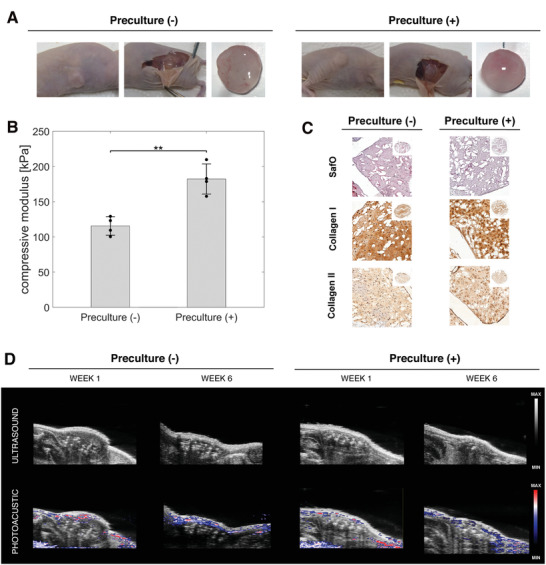
Figure 4.

In vivo implantation. A) Pictures showing the samples after subcutaneous implantation, without preculture and with 21 d of preculture. B) Compressive modulus of the samples without and with preculture. Data represents mean and standard deviation of n = 3 independent experiments. The p‐value was determined using a simple t‐test. C) Histological analysis of the in vivo samples. D) Ultrasound and photoacoustic of the samples at day 63 to confirm the absence of vascularization within the samples.
