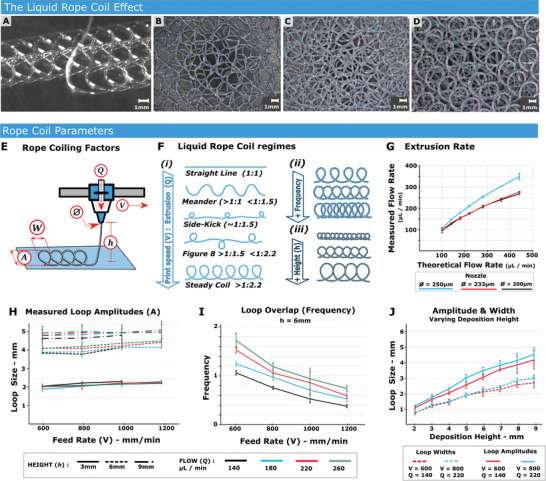
Figure 1.

The liquid rope‐coil effect. A) Silicone loops deposited on a glass substrate. Scale bar = 1 mm. B) Three‐layer Liquid Rope Coil (LRC) coating, where the first layer is deposited along the printer X axis, second is placed at a 45°, and the third is at negative 45°. Scale bar = 1000 µm. C) Example of a six‐layer structure – essentially a twice replicated version of (B). Scale bar = 1000 µm. D) The underside of the six layer structure. Scale bar = 1000 µm. E) Schematic showing parameters which affect the shape, frequency and amplitude [A] of an extruded rope coil. [Q] is Material Flow, and [Ø] is nozzle diameter (the product of which can be used to calculate the extruded bead length per unit time), V is Print‐head velocity (Feed Rate). The nozzle height above substrate [h]. F) The ratio of [V] against extruded material filament length (per time) defines the loop regime/shape up to a certain threshold of 1:2.2, after which point a steady loop regime is reached and subsequent increase in material flow will affect the overlap or “loop frequency.” i) Illustrations of various loop regimes. ii) Example of increasing the loop frequency from 0.5 to 2. iii) Illustration of loops that would occur as the nozzle height [h] is increased. G) Extruded filament length plotted against the theoretical flow rate, n = 3. H) Measured loop amplitudes at various heights, Feed rates, and extrusion flow rates, n = 3. I) The loop overlap (analogous to frequency) for various extrusion rates and feed rates, when holding height steady in this case, [h] = 6, n = 3. J) Variation in loop amplitude and width when keeping feed and flow rates constant and varying only nozzle height [h], n = 3.
