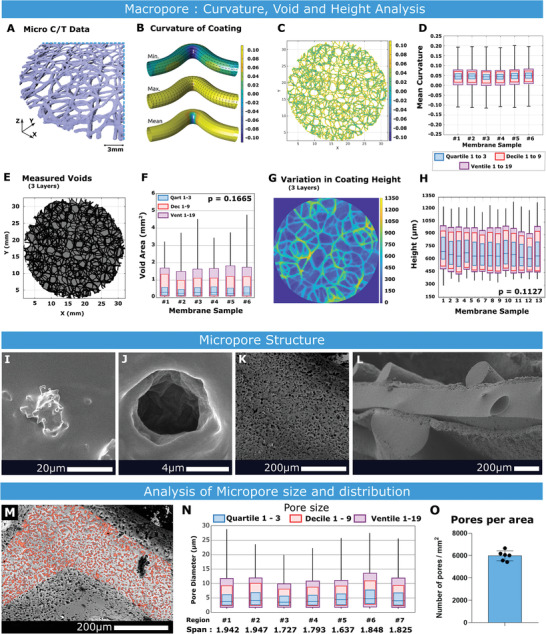
Figure 2.

Macro and Micro pore analysis. A) Section of LRC coating segmented from a Micro C/T scan. Scale bar = 1 mm. B) A schematic visualization of minimum, maximum, and mean curvature for an example filament. C) LRC coating visualizing mean curvature. D) Mean curvature across six samples of LRC coating, each boxplot showing Quartiles, Deciles, and Ventiles, n = 6. E) LRC coating showing deposited material (black) and voids (grey). F) 2D negative voids in the coating, n = 6. G) Representative image of LRC Coating height map. H) Height variation of LRC coatings across samples, featuring plots of Quartiles, Deciles, and Ventiles, n = 13. I) Nucleated salt crystal following spray deposition. J) Pore generated after washing. K) Surface topology of a rope‐coil filament after micro‐texturing over‐spray. L) Sandwich structure of implantable drug eluting pouch. M) Example Region of Interest (ROI). N) Distribution of pore sizes (in µm) across 7 ROIs, showing 50%, 90% and 95% quantiles, along with the calculated span of pore sizes, n = 7. O) Mean value for number of micro‐pores per area, n = 6.
