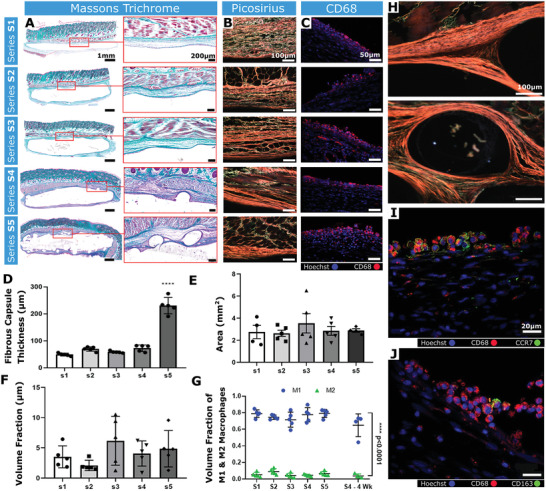
Figure 6.

Analysis of the fibrous capsule composition and the immune response. A) Representative Masson's trichrome‐stained histological sections (Scale bar = 1 mm) and associated high magnification images of the fibrous capsule (Scale bars = 200 µm). B) Representative images of tissue‐device interfaces of S1–S5 imaged with polarized light microscopy after picrosirius red staining. Orange/red = mature collagen, Green = immature collagen. Scale bars = 100 µm. C) Representative immunofluorescent image of CD68+ cells. Scale bar = 20 µm. D) Mean fibrous capsule thickness. E) Areas of tissue extending from the tissue‐device interface to the panniculus carnosus. F) Volume fraction of CD68 + cells. G) Volume fraction of CCR7 and CD163 macrophages to total CD68+ at 2 weeks and S4 device at 4 weeks (n = 4). M1 versus M2 S1–S5 ****p < 0.0001. H) Polarized light microscopy images of rope‐coil feature on S4 and S5. Scale bars = 100 µm. I) Representative immunofluorescent image of CD68 and CCR7 (M1 phenotype marker). Scale bar = 20 µm. J) Representative immunofluorescent image of CD68 and CD163 (M2 phenotype marker). Scale bar = 20 µm. n = 4–5 per group; data are means ± SEM; ***p < 0.001.
