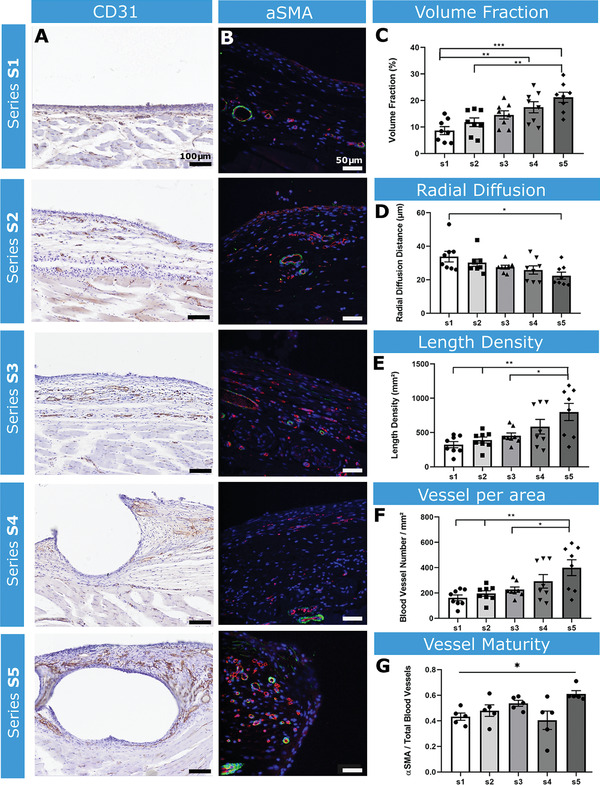
Figure 7.

Analysis of angiogenesis and vessel maturity surrounding the implanted devices. A) Representative images of CD31 staining samples S1–S5. Scale bar = 100 µm. B) Representative fluorescent images of α‐SMA (green) and CD31 (red) staining of S1–S5 at the tissue‐device interface. Scale bar = 50 µm C) Volume fraction of blood vessels. D) Radial diffusion distance. E) Length density of blood vessels F) Number of vessels per area. G) Ratio of α‐SMA to CD31+ vessels. n = 5 per group; data are means ± SEM; *p < 0.05, **p < 0.01, ***p < 0.001.
