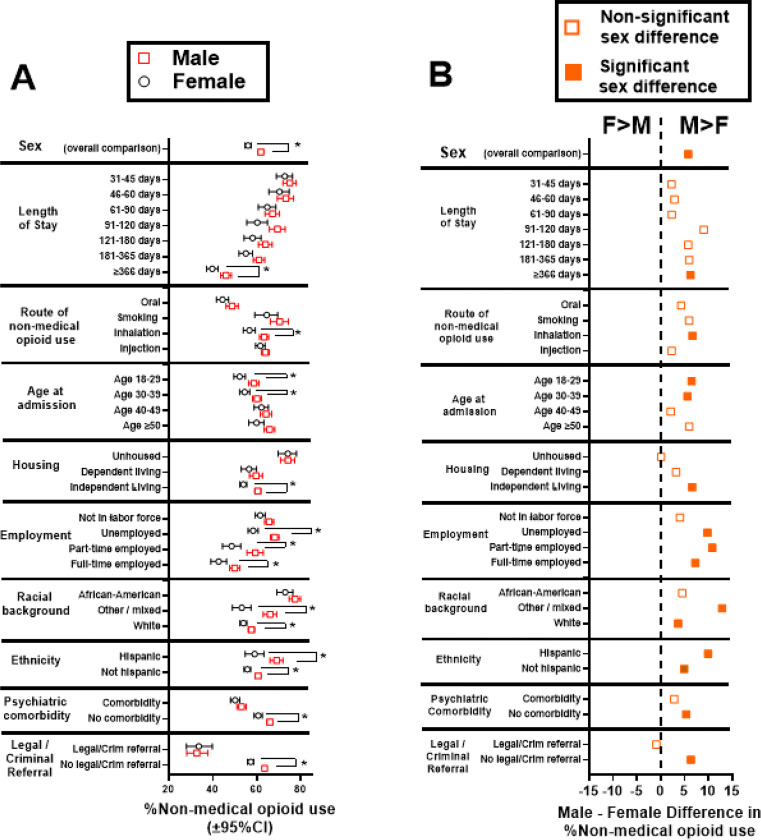
Fig. 1:
Fig 1A: Percent of males and females with NMOU; *Conditions with significant 2X2 contingency analyses by sex, after Bonferroni correction (see Table 1, which includes data for census divisions). Fig 1B: Male-Female differences in %NMOU (data from Fig. 1A). Positive values indicate greater %NMOU in males vs females (labeled “M>F” at the top), and negative values indicate greater %NMOU in females vs males (labeled “F>M”). Filled symbols indicate sex comparisons that survive Bonferroni corrections (Table 1); open symbols indicate comparisons that did not reach significance.

