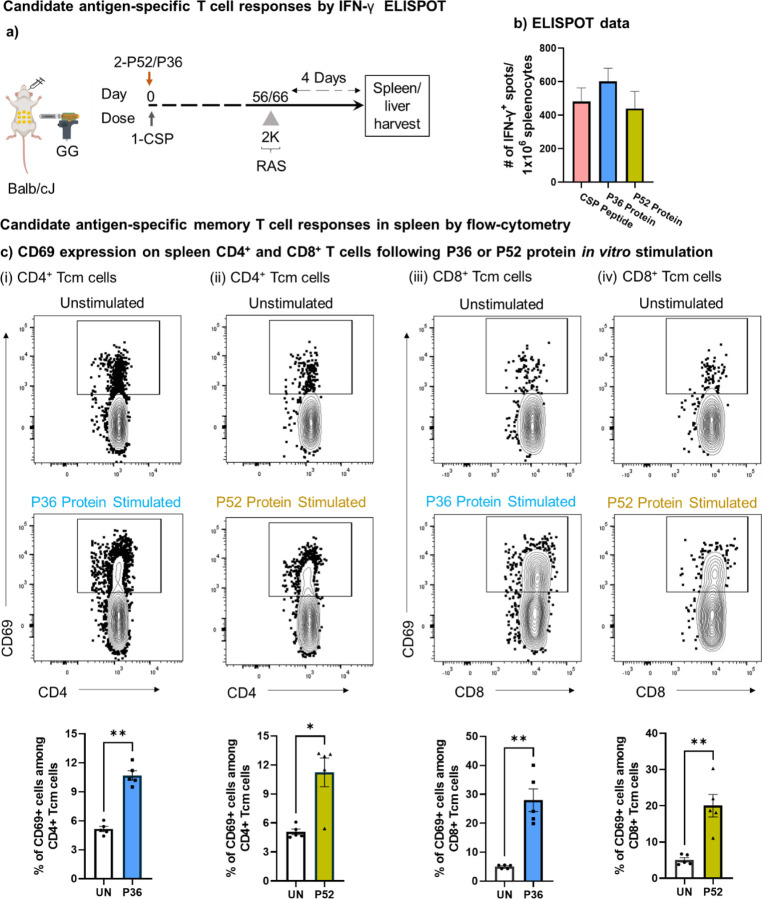
Figure 2: Antigen specific T cell responses against P. yoelii P36 and P52 antigens.
a). Mice were immunized with the protective cocktail of DNA encoded CSP and P36/P52 and 8–9 weeks later received 2K Py-RAS followed by liver/spleen harvest for further cellular analysis by ELISPOT and flow-cytometry as shown. b). Splenocyte ELISPOT data for in vitro stimulation with CSP peptide, P52 protein, and P36 protein. c). Splenocytes from immunized mice groups depicted in panel A were stimulated overnight in vitro with the P36 (i and iii) or P52 (ii and iv) proteins and were tracked through flow cytometry to identify the activation of (i-ii) CD4+ and (iii-iv) CD8+ Tcm cells using the CD69 marker. A fluorescence minus one (FMO) control was used to gate on CD69 expressing CD8+ and CD4+ T cells (S figure 2, panel b). To quantify T cell activation following antigen stimulation, protein antigen was not added to unstimulated wells (UN). Frequency of T cell activation following either P36 or P52 protein stimulation was compared using the graphs at bottom of each panel using the marker CD69. N=5 mice per group. Data is representative of two independent experiments. Data are the mean ± SEM. Data were analyzed by Mann-Whitney test. P<0.05 is considered significant. * P<0.05, ** P<0.01.

