. 2024 Oct 11;66:e61. doi: 10.1590/S1678-9946202466061

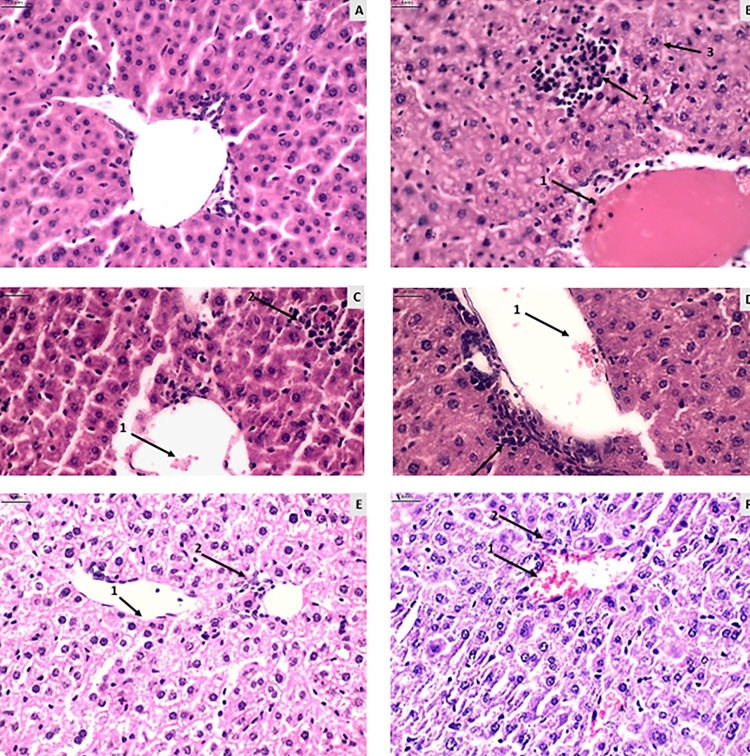
Figure 2. Histological photomicrographs of mouse liver tissue (magnification 400 times). A) Group I-A (uninfected and untreated): representation of liver tissue within the normal pattern with minimal hyperemia and inflammation. B) Group I-B (infected and saline-treated): presence of pronounced hyperemia (1), inflammation (2), and edema (3). C) Group I-C (infected and untreated): presence of hyperemia (1), inflammation, and necrosis (3). D) Group I-D (infected and untreated): presence of hyperemia (1) and inflammation (2). E) Group II-B (infected treated with NTZ 150mg/kg/day): presence of vasodilation (1) and inflammation (2). F) Group II-C (infected treated with Pyrimethamine and Sulfadiazine): presence of hyperemia (1) and inflammation (2). Scale for all images = 4 nm.

Figure 2