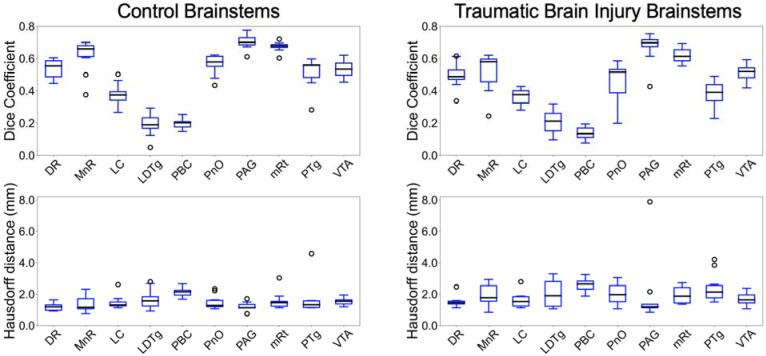
Figure 3. Bayesian segmentation accuracy in control and TBI T1 MRI scans.
Displayed in the left panel are box plots of Dice coefficients (top) and associated 95% Hausdorff distances (bottom) from direct comparisons of automated segmentations and manual annotation of each AAN nucleus in ten T1 MRI scans from healthy control subjects. Shown in the right panel are Dice scores (top) and HD (bottom) derived from 10 Traumatic Brain Injury patients with deformed and/or lesioned brainstems. Divisions of the box plots are 25th percentile, median, and 75th percentile.

