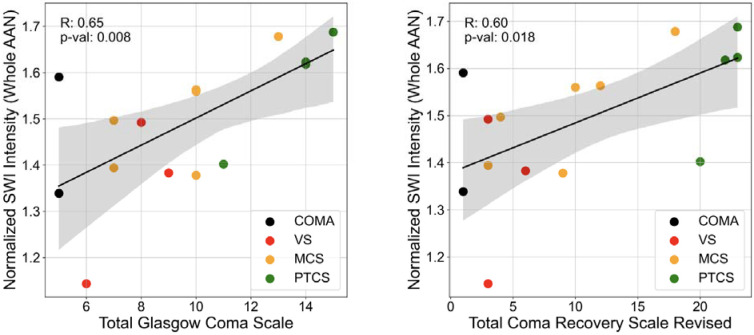
Figure 8: SWI AAN correlations with LoC.
SWI intensities were averaged across segmented AAN masks and normalized by average SWI intensities in the lateral ventricles across all TBI patient scans. This normalized AAN SWI value was calculated for 16 acute TBI patients and correlated with their assigned LoC assessments: the GCS-T (left panel), and the CRSR-T (right panel). Coloring of the scatter points indicate each TBI patient's general LoC classification: coma, VS: vegetative state, MCS: Minimally-Conscious State, and PTCS: Post-Traumatic Confusional State. R values are derived directly from a linear least-squares regression and p values indicate significance of deviation of the regression lines from a zero-slope based on a two-tailed Wald t-test.

