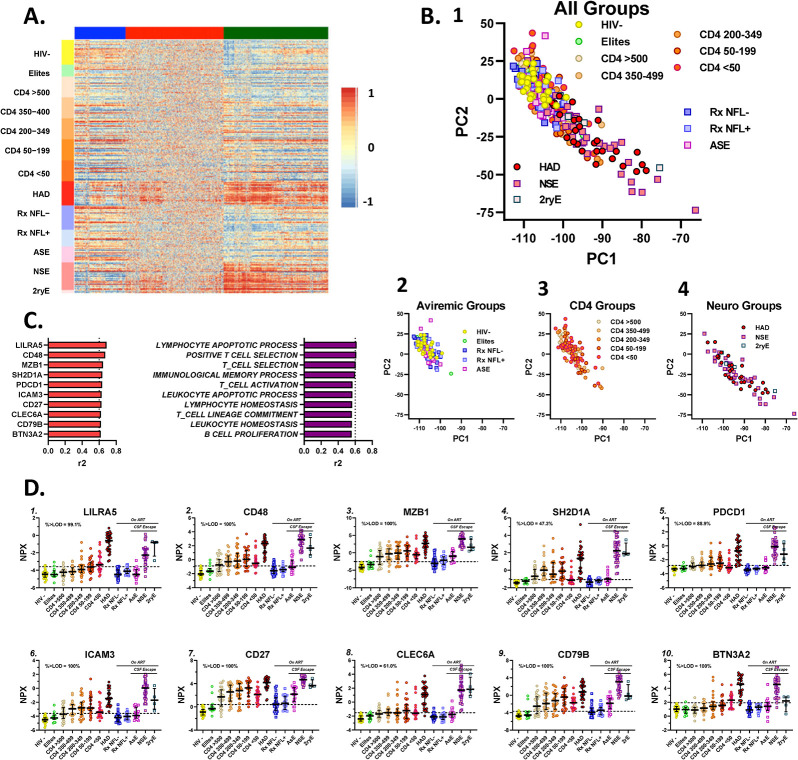
Fig 2. Overview of CSF proteins across subject groups.
The assembled panels depict some of the main features of the CSF protein changes across the set of subject groups. A. This hierarchical cluster analysis displays the full set of the Olink CSF protein measurements in a heatmap. The study groups (and the individual CSF samples within each group) are arranged on the vertical axis, while the proteins are grouped across the figure after segregation into three clusters designated by colors at the top within BLUE, RED and GREEN columns of the measurements of individuals proteins in each sample. The heatmap relative scale from -1 (blue) to 0 (yellow) to 1 (red) is shown to the right of the main figure. The individual proteins are color-scaled according to their relative concentrations. The most conspicuous gradations in scale are within the GREEN cluster (right column) in which many samples from the HAD group and the two symptomatic escape groups (NSE and 2ryE) stand out with higher (red) concentrations compared to the generally lower concentrations (blue and yellow) in the non-viremic individuals (HIV-, elites, and RxNFL+ and RxNFL-) with some mixed colors over this spectrum in the CD4-defined groups. By contrast, the RED cluster (middle column) showed a more even and mottled spectrum except for some of the proteins shown on the left side of this cluster in which there was red predominance in the HAD and two symptomatic escape groups similar to, but less pronounced than, in the GREEN cluster. The changes among groups in the BLUE cluster (left column) are less distinct but with some low (blue) concentrations in the CD4 <50, HAD and two symptomatic escape groups (NSE and 2ryE), and higher concentrations in the HIV- group, i.e., showing some patterns that are opposite to (or inverted in comparison to) those in the GREEN cluster. Overall, the HAD and two symptomatic escape groups accounted for the greatest concentration differences from the controls among the proteins, most prominently in the GREEN cluster. B. This PCA analysis using results of all the measured CSF proteins to assess effects of the overall CSF measurements on individual subjects and their groups provides a different perspective on the protein changes across the groups. 1. This panel includes the results from all the groups and shows a ‘gradient’ downward and to the right of the panel associated with HIV-1 systemic disease progression (as indicated by falling blood CD4+ T-cell counts) and, more particularly, with the symptomatic neurological disease groups, so that individuals with HAD and NSE reach farther in this direction. Because of the superimposition of many of the individual in this panel, three smaller panels (Fig 2B2-4) separate these groups for better visual definition of these changes. 2. the aviremic groups including the HIV-, the largely superimposed elites, treated-suppressed (RxNFL- and RxNFL+) and the ASE group are all grouped together with overlap in the upper left of the plot; 3. the five CD4-defined groups are also largely clustered in the same upper left area but with some individuals ‘moving’ down and to the right as immunosuppression advanced with lower blood CD4+ T-cell counts; 4. the HAD and two symptomatic escape groups (NSE and 2ryE) showed some overlap with the other groups but with further movement down and to the right (higher PC1 and lower PC2 values), again consistent with these neurological groups importantly ‘driving’ the main group differences in the aggregate CSF protein changes across the large cohort sample. Thus, these groups, defined clinically, are also, not surprisingly, separated in this analysis by the changes in their CSF proteomes. C. Proteins and pathways influential in distinguishing subject groups. The two bar plots show the proteins and pathways that most influenced the overall differences among the subject groups. The left bar graph lists the most influential proteins, all 10 of which are markers of inflammatory processes. The right bar graph lists the most influential defined pathways extracted from the protein changes, and again their designations emphasize that they identify inflammatory processes, including several involving T-cells. While, in part this may reflect the large number of inflammatory proteins that were included in the Explore 1536 panel, many with intersecting or overlapping functions, it also clearly shows that changes in inflammatory profiles largely determine the contours of the overall measured CSF proteome as systemic disease progressed and, particularly, as overt CNS disease with HIVE developed. D. Influential protein patterns across study subjects. These plots show the subject group concentrations of the 10 most influential proteins (from the left side of Fig 2C above) across the subject groups using the color schema introduced in Fig 1 and used throughout this report. This includes the color symbols, medians and IQR bars, and the dashed horizontal line that indicates the mean + 2 SD of the HIV- control group in this study as an estimate of the upper limit of these variables and aids as visual reference across the groups. Protein concentrations are expressed in log2 NPX units with varying scales. The plots show the prominence of the increases in the HAD and NSE groups and their dominating influence; these two groups had the highest concentrations of all 10 of these CSF proteins, with lower and more variable patterns of elevation in the CD4-defined and other groups. As annotated in the panels, of the 10 listed proteins, the measurements in six were all (100%) above the LODs for the assay. The exceptions included LILRA5, SH2D1A, PCDC1, and CLEC6A in which 99.1%, 47.3%, 88.9% and 61.0%, respectively, of the proteins were above the LODs (shown in the individual panels here as in subsequent figures of protein patterns across the subject groups). These influential proteins are all within the GREEN cluster in Fig 2A and are listed in the Glossary of Featured Proteins in Fig 2 included in S1 Appendix with brief functional descriptions extracted from UniProt database (https://www.uniprot.org/uniprotkb?query=*) [140], along with comments on selected features of the individual panels.

