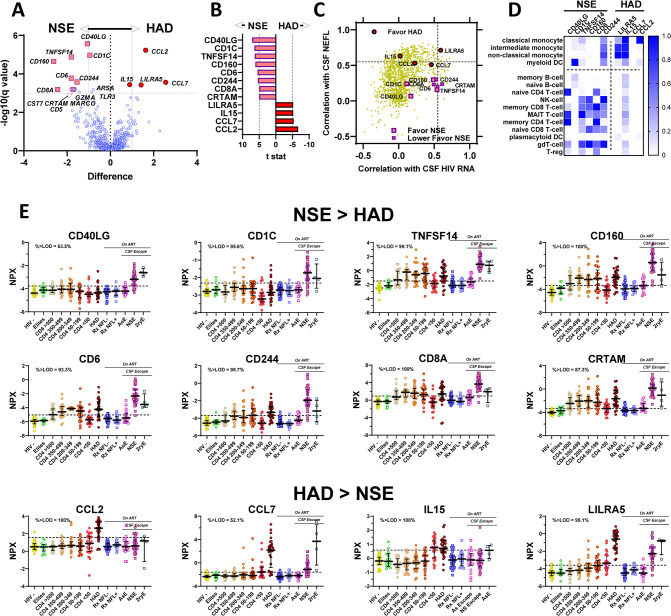
Fig 4. CSF proteins favoring NSE vs HAD.
This figure examines CSF protein differences between NSE and HAD. A. Comparison of CSF proteins in NSE and HAD groups. Both of these conditions are forms of HIVE with elevations of multiple CSF proteins. For the most part, the protein elevations do not differ significantly, and this volcano plot shows a high degree of protein similarity (or lack of significant differences) within the context of the full complement of measured proteins (identified by simple blue symbols) on each side of the central vertical axis. However, there are a few identified protein differences, indicated by the enlarged labelled symbols formatted using the NSE and HAD symbols. The remaining panels of the figure focus on these distinguishing proteins. B. CSF proteins distinguishing NSE and HAD subject groups. Proteins identified by t stat of ≥ +/- 5 are the same those singled out in Fig 4A volcano plot, with eight proteins favoring NSE and four favoring HAD. C. NSE and HAD distinguishing proteins in the context of their correlations with CSF NEFL and CSF HIV. This panel shows all the measured Olink proteins (except NEFL) in the context of their correlations with CSF NEFL and CSF HIV RNA using the same format as Fig 3C, but, for clarity, with a neutral yellow color for the full array of proteins rather than the GREEN, BLUE and RED designations from the hierarchical cluster analysis. The significant proteins identified in the volcano plot and t stat above (Fig 4A and 4B) are indicated by enlarged symbols. All are from the GREEN group of the cluster analysis. The proteins favoring both neurological conditions are similarly variable across a range of correlations with CSF HIV-1 RNA but located in different vertical strata with respect to NEFL correlation. Those favoring HAD are in a higher range of correlation with NEFL than those favoring NSE. This may relate, at least in part, to the generally lower levels of NEFL in NSE than HAD (Fig 2A). D. Cellular associations of proteins favoring NSE and HAD. This simple presentation draws on literature sources describing the cell associations of 10 of the proteins identified in Fig 4A and 4B, https://www.proteinatlas.org/ and [156] with the darkness of the square indicating strength of the cell relations. The proteins listed as favoring NSE are largely associated with lymphocytes (B, T and NK lineages), while those favoring HAD associate with myeloid cells, consistent with a different balance of inflammatory cells in these two forms of HIVE. E. Different patterns of high-correlating proteins in NSE and HAD across subject groups. The format of the graphs in this panel is the same as in previous figures showing Olink protein concentrations across the subject groups. The upper two rows plot the protein concentrations of the 8 proteins favoring NSE while the bottom row plots the proteins favoring HAD as identified in Fig 4A and 4B above. In the upper two rows, the median concentrations in the NSE group are greater than those of the comparable HAD group which are either normal or near the highest values among the CD4-defined groups. The CD4-defined groups exhibit the lymphoid pattern with varying levels of increase in the middle brackets. The bottom row shows the patterns of the four proteins that favor HAD. Most notably, the values of HAD group are higher than those of NSE group, and the CD4-defined group patterns are either flat or show an increase in the CD4<50 group above the groups with higher CD4+ T-cell counts, closest to the myeloid or perhaps neuronal patterns, but with clear variation in the magnitude of differences of the CD4<50 from the other CD4-defined groups. The dashed horizontal line in each panel again designates the mean +/- 2 SD of the HIV- control group for visual reference. The identified proteins in Fig 4E are listed in S1 Appendix with brief functional descriptions extracted from UniProt database (https://www.uniprot.org/uniprotkb?query=*) [140].

