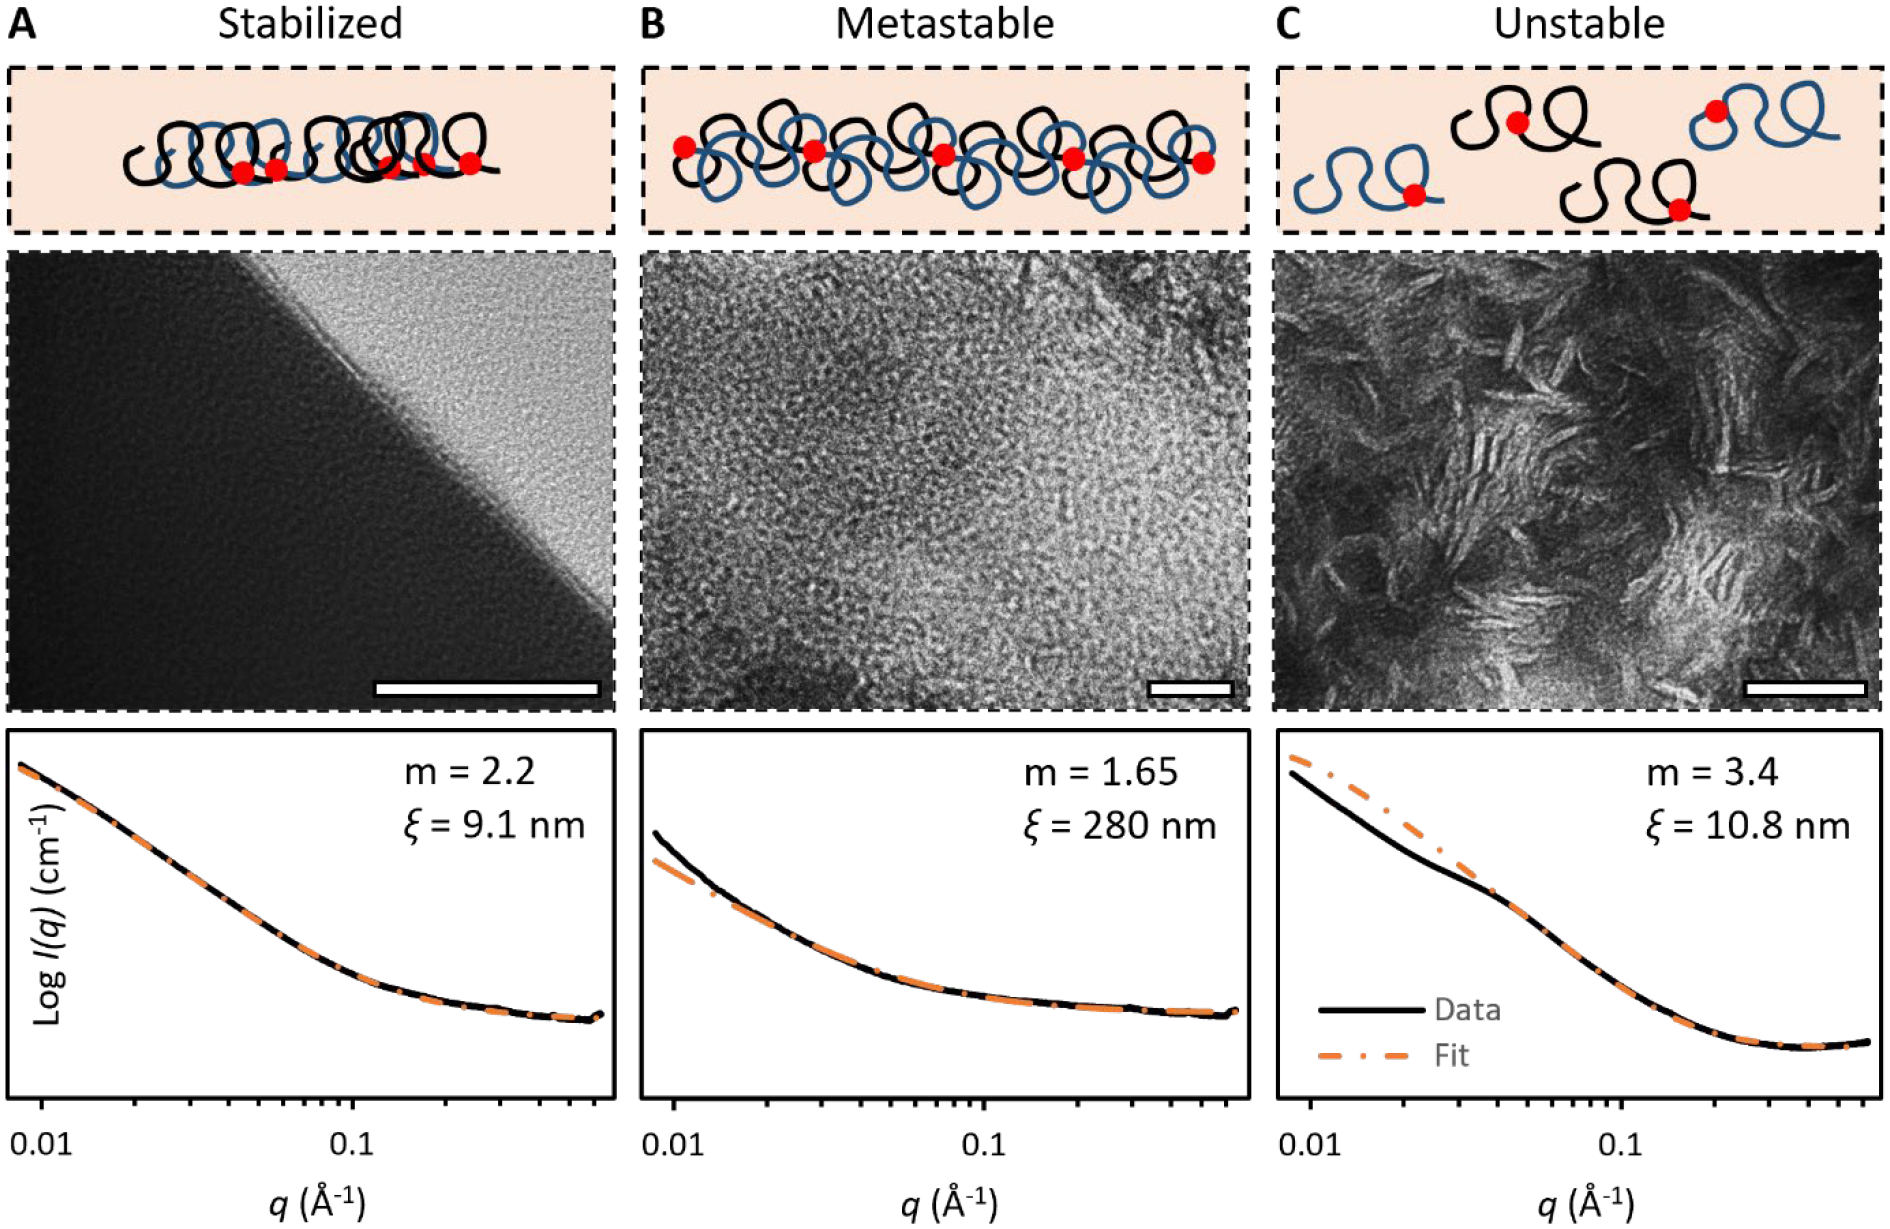
Figure 3. Energy state – structure relation.

TEM images and SAXS of gelatin hydrogels comprising networks at (A) stabilized state, (B) metastable state, and (C) unstable state. Porod exponent m and correlation length ξ were measured by fitting SAXS curve for the correlation length model. Scale bar: 50 nm.
