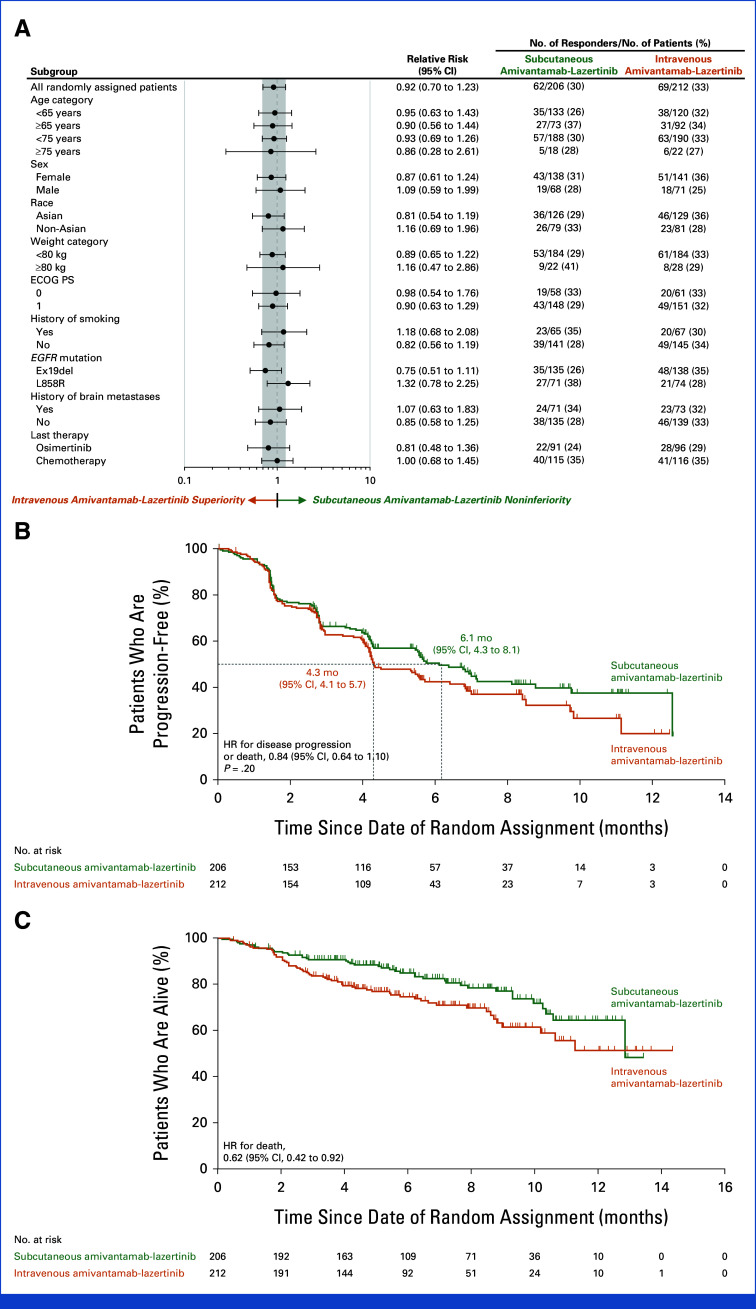
FIG 2.
(A) Objective response forest plot, (B) PFS, and (C) OS. The efficacy population included all patients who had undergone random assignment. (A) The shaded area indicates 95% CIs for the relative risk in all patients; the subgroup analyses were not part of the hypothesis testing and results are reported without adjustment for multiplicity. (B, C) The dashed lines indicate the median PFS and OS, respectively, in the two groups, and the tick marks indicate censoring of data. ECOG PS, Eastern Cooperative Oncology Group performance status; HR, hazard ratio; ORR, objective response rate; OS, overall survival; PFS, progression-free survival.

