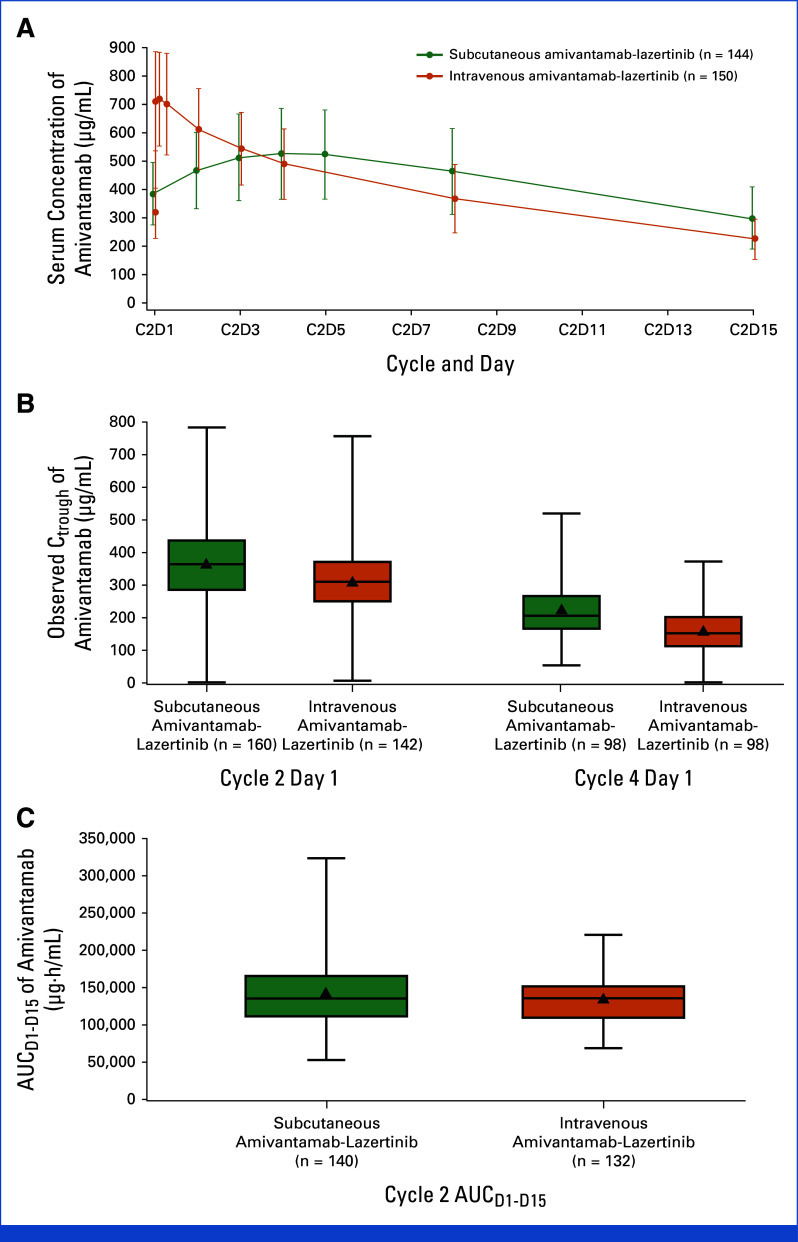
FIG A3.
(A) Observed concentration-time profiles, (B) Ctrough, and (C) AUCD1-D15 of amivantamab. To capture the peak concentration of intravenous amivantamab, two samples were analyzed soon after the end of infusion (at 10 minutes and 2 hours after intravenous infusion). The upper and lower end of the boxes indicate the 25th and 75th quartiles, respectively, the triangles indicate the means, the horizontal lines within the boxes indicate the medians, and the error bars indicate 95% CIs. AUC, area under the concentration-time curve; AUCD1-D15, AUC between Cycle 2 Day 1 and Day 15; C, Cycle; Ctrough, observed serum concentration of amivantamab at steady state; D, Day.

