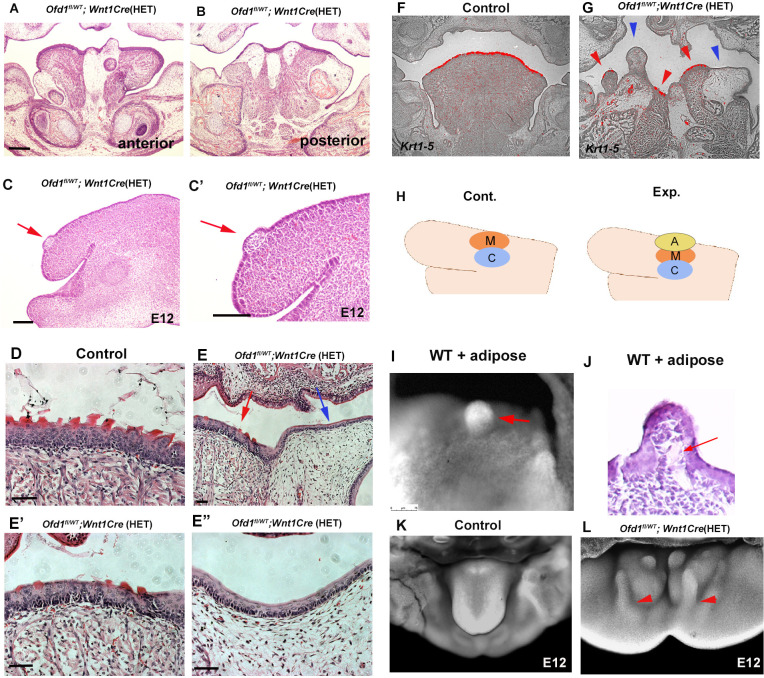
Figure 8. Adipose tissue in Ofd1 mutant tongue.
(A, B, C–E’’) Frontal (A, B, D–E’’) and sagittal (C, C’) sections showing histological images in wild-type (D), and Ofd1fl/WT;Wnt1Cre(HET) (A–C’, E–E’’). E’ and E’’ are high magnification of E. (F, G) Frontal sections showing in situ hybridization of Krt1-5 in wild-type (F) and Ofd1fl/WT;Wnt1Cre(HET) (G). (H) Schematic diagram showing sagittal view of mandible exhibiting graft of adipose tissue (A, yellow circle), cranial neural crest-derived cells (CNCC) (C, blue circle) and myoblasts (M, red circle). (I) Nuclear fluorescent image showing dorsum of tongue in cultured mandible with grafting. (J) Histological images of dorsum of tongue in cultured mandible with grafting. (K, L) Nuclear fluorescent image showing oral view of developing mandibles in wild-type (K) and Ofd1fl/WT;Wnt1Cre(HET) (L). Arrowheads indicating protrusion into the floor of mandible from the dorsum surface of tongue swelling (L). Scale bars: 200 µm (A, B, F, G), 100 µm (C-E’’).

