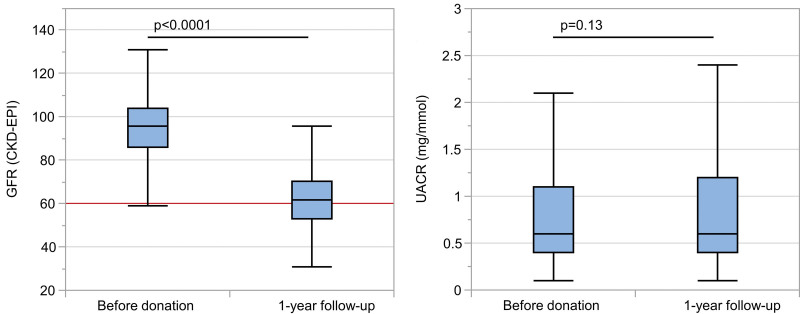
FIGURE 2.
Course of kidney function and albuminuria before and 12 mo after kidney donation. The box plots show (A) eGFR before and 12 mo after kidney donation as well as UACR at the same timepoints (B). The red line in (A) indicates an eGFR level of 60 ml/min/1.73m2. eGFR, estimated glomerular filtration rate (calculated by the CKD-EPI formula; in ml/min/1.73m2 of body surface); CKD-EPI, Chronic Kidney Disease Epidemiology Collaboration; UACR, urine albumin-to-creatinine ratio (mg/mmol).

