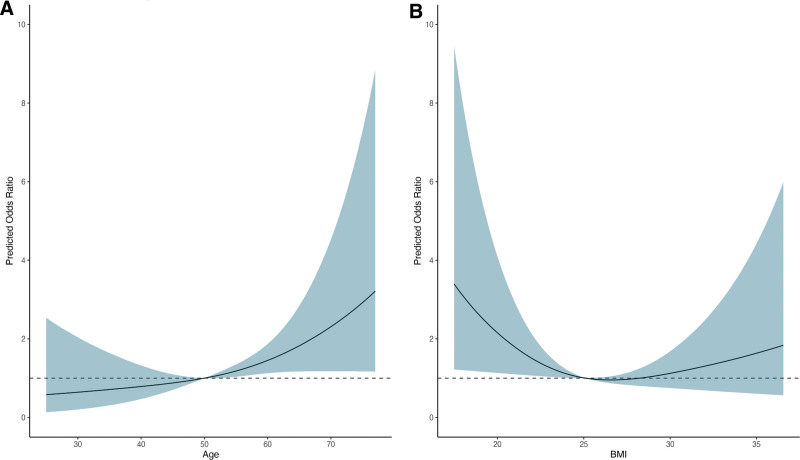
FIGURE 3.
Restricted cubic spline plot of the association between donor age and BMI with major early complications. The dark line indicates the predicted odds ratio for age (A) and BMI (B) with major complications modeled by restricted cubic splines. The blue area represents the 95% confidence interval. For age a reference value of 50 was chosen, for BMI a reference value of 25 was chosen. BMI, body mass index.

