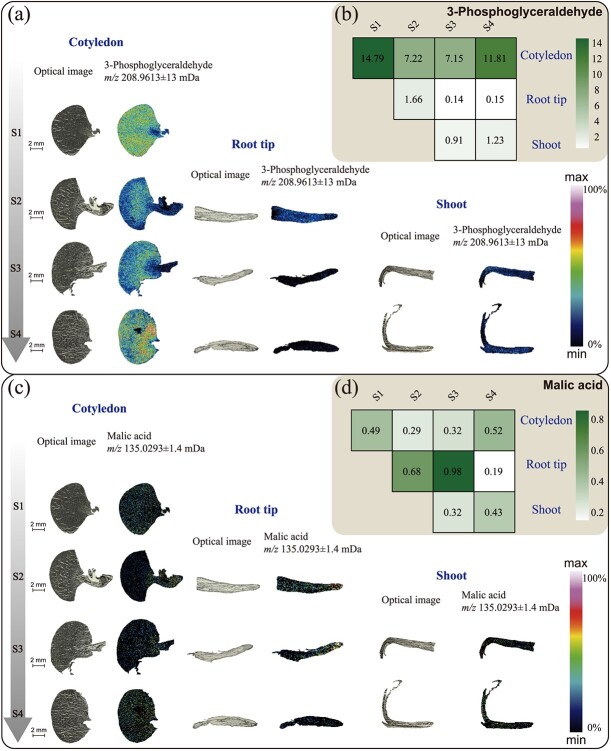
Figure 4.
Spatial MSI distribution and relative contents of 3-phosphoglyceric acid and malic acid. a, c Optical images (left) and ion distribution images (right) of 3-phosphoglyceric acid and malic acid in cotyledons, root tips, and stems (leaf buds) at four developmental periods. The color scale indicates increasing content of target substances from dark black to purple in a sequential manner in the region. b, d Heat maps of the relative content of 3-phosphoglyceric acid and malic acid in different samples. The color scale indicates a sequential increase in relative content from white to green.

