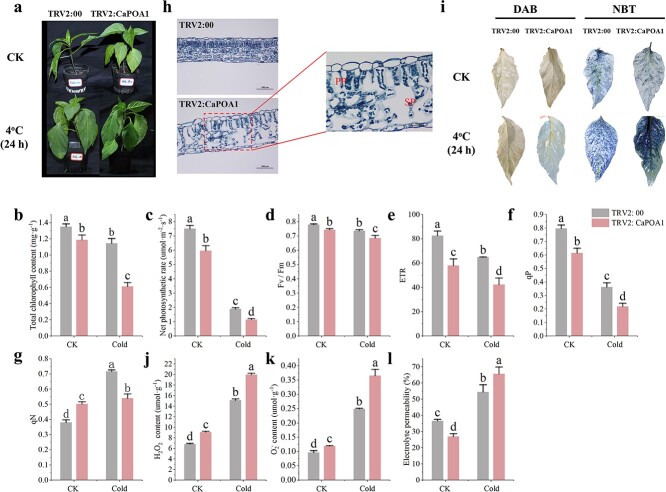
Figure 7.
CaPOA1 silencing reduces the cold tolerance of pepper. Values are means ± SD from three independent experiments. Values with different letters above the bars are significantly different at P < 0.05. (a) Comparison phenotypes between CaPOA1-silenced plants and control plants. (b) Total chlorophyll content. (c) Net photosynthetic rate. (d) Fv/Fm. (e) ETR. (f) qP. (g) qN. (h) Transverse sections of leaves of CaPOA1-silenced plants and control plants at low temperature. PP: palisade tissue; SP: spongy tissue. (i) NBT and DAB histochemical staining. (j) H2O2 content. (k) O2− content. (l) Electrolyte permeability.

