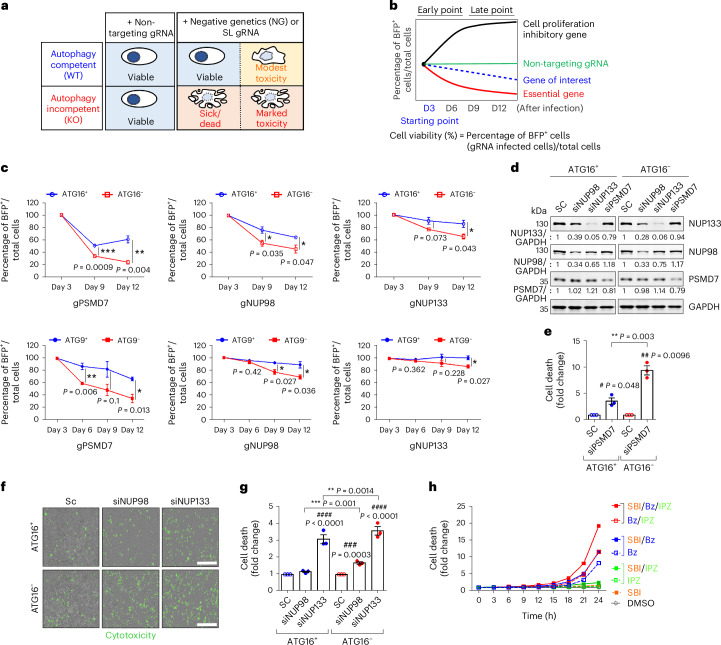
Fig. 1. Identification of negative genetic interactors with autophagy compromise.
a, Schematic representation of FACS-based CRISPR/Cas9 synthetic lethality (SL) screen to identify SL regulators required for survival during autophagy compromise. b, Quantification of cell viability assessed the percentage of BFP+ (blue fluorescent protein-positive (BFP), gRNA-infected) cells normalized to the number of total cells after transduction with gRNAs that are present in BFP+ cells, as the lentivirus vector carrying the gRNAs also expresses BFP. c, Quantification of cell viability with gRNAs for the indicated SL candidate genes (gPSMD7, gNUP98 and gNUP133) in autophagy-incompetent cells (HeLa/ATG16L1 knockout (KO) (ATG16−)/Cas9 (top), HeLa/ATG9 KO (ATG9−)/Cas9 (bottom)) compared with their respective controls (autophagy-competent cells) (n = 3 technical triplicates after initial infected plates split into three plates of a 96-well plate for ATG16L1 WT versus KO cells and ATG9 WT versus KO cells. Percentage of BFP+ cells/total cells at 3 days set to 100% in all conditions to allow us to determine relative loss of cells over time in autophagy-competent versus autophagy-incompetent cells; two-tailed unpaired t-test). d, Immunoblots for SL candidate protein levels after each siRNA knockdown (representative blot from three biological repeats). e, Knockdown of PSMD7 enhances cell death in ATG16L1 KO measured by LDH assay (day 3) (n = 3 independent experiments; two-tailed paired t-test). f, Illustration of readouts of Incucyte cell death assay (measured by Incucyte live-cell imaging). Scale bar, 600 μm. g, Quantification of CellTox Green fluorescence intensity after siRNA-mediated knockdown of NUP98 or NUP133 (day 5) versus scramble control siRNA (SC) (n = 3 independent experiments; two-way analysis of variance (ANOVA) with post hoc Tukey test). h, Combined effect of autophagy inhibition (SBI-0206965 (SBI) 5 μM) with proteasome inhibition (bortezomib (Bz) 1 μM) and/or nuclear import inhibition (importazole (IPZ) 2 μM) on HeLa cell death (Incucyte cell death assay with CellTox Green fluorescence). When we compute areas under the curve for four biological replicates, then SBI versus SBI + Bz, P = 0.013; SBI versus SBI + IPZ, P = 0.047 (one-tailed paired t-test). Values are mean ± s.e.m. For comparisons between ATG16+ and ATG16− cell lines: * P < 0.05; ** P < 0.01; *** P = 0.001; for comparisons to relevant ATG16+ and ATG16− control within cell line: # P < 0.05, ## P < 0.01, ### P < 0.001, #### P < 0.0001. Source numerical data and unprocessed blots are available in source data.

