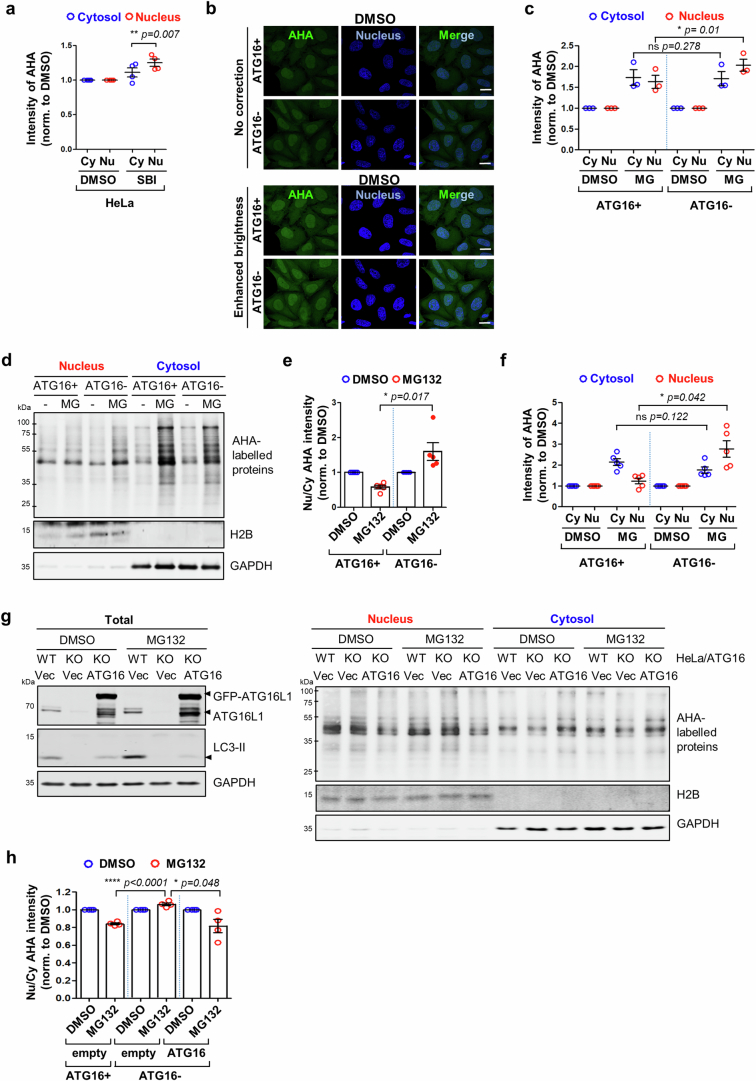
Extended Data Fig. 6. Bulk proteins overflow into nucleus under the autophagy depletion.
a, Localization of newly synthesized proteins (AHA-labelled proteins) in ATG16L1 WT (ATG16+) and KO (ATG16-) cells treated with autophagy kinase inhibitor SBI-0206965 (SBI, 5 µM) assessed by Click-iT assay for immunostaining. Data showing a nucleus/cytosol intensity ratio of AHA-labelled proteins in Fig. 2i is divided between AHA-labelled protein intensity in nucleus (Nu, red) and cytosol (Cy, blue) upon SBI treatment. Values are mean ± S.E.M. (n = 4 biologically independent experiments; ** p < 0.01 vs. DMSO; two-tailed paired t-test) b, c, Localization of newly synthesized proteins (AHA-labelled proteins) in ATG16L1 WT (ATG16+) and KO (ATG16-) cells treated with MG132 (MG) using immunofluorescence. b, Control data for AHA labelling in ATG16L1 WT and KO cells in DMSO by immunofluorescence. MG132 data are in Fig. 2j. Upper panel (No correction) shows the raw image micrographs at exposures that match Fig. 2j, for which this is the control. Lower panel (Brightness enhancement) shows increased brightness so that AHA signal can be more easily seen. Scale bar, 20 µm. c, Data from the nucleus/cytosol intensity ratio of AHA-labelled proteins in Fig. 2j is divided between AHA-labelled protein intensity in nucleus (Nu, red) and cytosol (Cy, blue) upon MG132 treatment. Values are mean ± S.E.M. (n = 3 biologically independent experiments; ns = not significant; * p < 0.05 for relative changes induced by MG in WT vs. KO cells; two-tailed paired t-test). d-f, Localization of newly synthesized proteins (AHA-labelled proteins) in ATG16L1 WT (ATG16+) and KO (ATG16-) cells treated with MG132 (MG) using immunoblotting after nucleus and cytosol fractionation. e, Quantified data from the intensity ratio of nucleus/cytosol-localized AHA-labelled proteins upon MG132 treatment. Values are mean ± S.E.M. Blots (d) are representative of 5 biologically independent experiments. (* p < 0.05 for relative changes induced by MG in WT vs. KO cells; two-tailed paired t-test). f, Data from the nucleus/cytosol intensity ratio of AHA-labelled proteins in Extended Data Fig. 6e is divided between AHA-labelled protein intensity in nucleus (Nu, red) and cytosol (Cy, blue) upon MG132 treatment. Values are mean ± S.E.M. (n = 5 biologically independent experiments; ns = not significant; * p < 0.05 for relative changes induced by MG in WT vs. KO cells; two-tailed paired t-test). g, h, Effect of autophagy rescue by ATG16L1 on newly synthesized protein localization in ATG16L1 KO cells treated with MG132. g, Representative blots show ATG16L1 rescue on autophagy in ATG16L1 KO (left) and localization of newly synthesized proteins in nucleus or cytosol under the ATG16L1 rescued condition (right) described in Fig. 2k. h, Intensity of Nucleus/Cytosol-localized AHA-labelled proteins by immunofluorescence. Values are mean ± S.E.M. (n = 4 independent experiments; **** p < 0.0001 for relative changes induced by MG132 in WT/empty vs. KO/empty cells, * p < 0.05 for relative changes induced by MG132 in KO/empty vs. KO/GFP-ATG16 overexpression (ATG16); two-tailed paired t-test). Source numerical data and unprocessed blots are available in source data.

