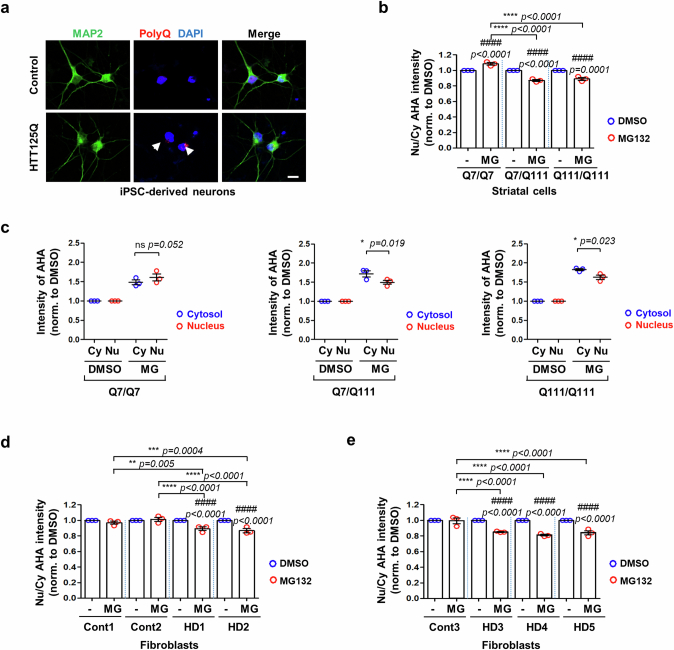
Extended Data Fig. 8. Relocation of newly synthesized proteins to the nucleus is inhibited in HD upon proteasome inhibition.
a, Validation of HTT125Q-derived neurons by immunofluorescence compared to control iPSC-derived neurons using polyQ antibody and MAP2 antibody (neuronal marker). Arrowhead indicates huntingtin aggregates. Scale bar, 10 μm. b and c, Reduced nuclear localization of newly synthesized proteins (AHA-labelled proteins) in mouse striatal cells expressing homozygous mutant (Q111/Q111) or heterozygous mutant (Q7/Q111) huntingtin upon MG132 treatment (MG, 1 µM for 15 h) compared with Q7/Q7 (wild-type). b, Quantified data from the intensity ratio of nucleus/cytosol-localized AHA-labelled proteins upon MG132 treatment. Values are mean ± S.E.M. (n = 3 independent experiments; #### p < 0.0001 vs. DMSO; **** p < 0.0001 for relative changes induced by MG132 in wild-type vs. HD striatal cells; two-way ANOVA with post hoc Tukey test). c, Data from the nucleus/cytosol intensity ratio of AHA-labelled proteins in (b) is divided between AHA-labelled protein intensity in nucleus (Nu, red) and cytosol (Cy, blue) upon MG132 treatment. Values are mean ± S.E.M. (n = 3 independent experiments; ns = not significant; * p < 0.05 for relative changes induced by MG132 in cytosol vs. nucleus. d, Localization of newly synthesized proteins in HD fibroblasts expressing mHTT-polyQ65 (HD1) or mHTT-polyQ80 (HD2) compared with control (Cont1, Cont2). Decreased nuclear localization of newly synthesized proteins in HD fibroblasts (HD1, HD2) compared with Controls (Cont1, Cont2) treated with MG132 (1 µM for 15 h). Values are mean ± S.E.M. (n = 3 independent experiments; #### p < 0.0001 vs. DMSO; ** p < 0.01,*** p < 0.001, **** p < 0.0001 for relative changes induced by MG132 in Cont vs. HD fibroblasts; two-way ANOVA with post hoc Tukey test). e, Localization of newly synthesized proteins in HD fibroblast (HD3, HD4, HD5) compared with control (Cont3). Decreased nuclear localization of newly synthesized proteins in HD fibroblasts compared with control (Cont3) upon MG132 treatment (1 µM for 15 h). Values are mean ± S.E.M. (n = 3 independent experiments; #### p < 0.0001 vs. DMSO; **** p < 0.0001 for relative changes induced by MG132 in Cont vs. HD fibroblasts; two-way ANOVA with post hoc Tukey test). Source numerical data are available in source data.

