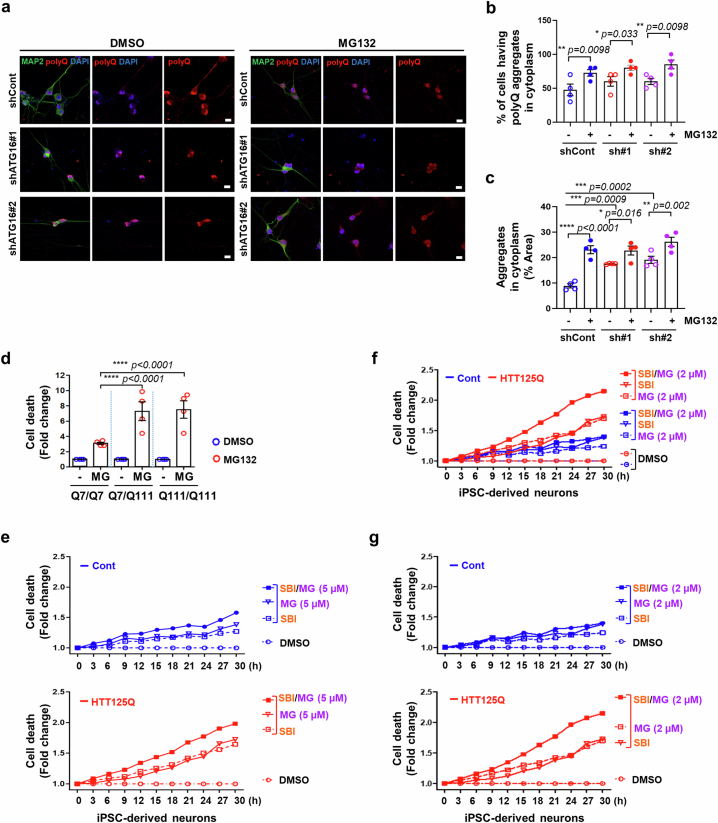
Extended Data Fig. 10. Cytoplasm to nucleus trafficking of AHA-labelled proteins is inhibited in HD in response to both autophagy and proteasome inhibition, leading to detrimental consequences.
a-c, HTT125Q-derived neurons were infected with either shControl (shCont) or shATG16 (sh#1, sh#2) for 4 days and then neurons were treated with either DMSO or MG132 for 15 h. a, Neurons were fixed and labelled with PolyQ (red), neuronal marker MAP2 (green) and DAPI (blue). Scale bar, 10 μm. b, Quantification of the percentage of cells having polyQ aggregates in cytoplasm of the cell body (Value are mean ± S.E.M, n = 4 biological independent experiments; * p < 0.05, ** p < 0.01 vs. DMSO; two-way ANOVA with post hoc Tukey test). c, Quantification of the percentage of cytoplasmic area in the cell body occupied by aggregates upon autophagy compromise and/or proteasome inhibition (Value are mean ± S.E.M, n = 4 biological independent experiments; * p < 0.05, ** p < 0.01, *** p < 0.001, **** p < 0.0001 vs. DMSO; two-way ANOVA with post hoc Tukey test). d, The effect of prolonged proteasome inhibition on cell death in HD mouse striatal cells. Cell death was detected by CellTox Green after MG132 treatment (1 µM) for 24 h. (Value are mean ± S.E.M, n = 4 biological independent experiments; **** p < 0.0001 for relative changes induced by MG132 in Cont vs. HD striatal cells; two-way ANOVA with post hoc Tukey test) e-g, Effect of autophagy inhibition (SBI) and/or proteasome inhibition (MG) on cell death in control iPSC-derived neurons and HTT125Q-derived neurons. Cell death measured CellTox Green fluorescence by Incucyte live-cell imaging in a time-dependent manner. The cell death experiments in Fig. 5a are shown with a high concentration of MG132 (Fig. 5a, Extended Data Fig. 10e (Cont and HTT125Q, respectively)) and the same experiment with a low concentration of MG132 is shown in (f and g) for ease of viewing. e, Representative graph with three biologically independent experiments described in Fig. 5a. Cell death by autophagy inhibition (SBI, 10 µM) and/or proteasome inhibition (MG, 5 µM) in control iPSC-derived neurons (top) and HTT125Q-derived neurons (bottom). Data in Fig. 5a are divided between control and HTT125Q-derived neurons in (e) for ease of viewing. f, g, Graphs showing cell death in Control and HTT125Q iPSC-derived neurons treated with proteasome inhibitor MG132 (MG, 2 µM), autophagy inhibitor SBI (10 µM) and/or both (SBI + MG). Data in (g) show the data extracted from (f) restricted to DMSO, SBI, MG and SBI + MG in control iPSC-derived neurons (top) and HTT125Q-derived neurons (bottom) to enable ease of comparisons. These graphs do not show error bars which make the graphs too messy. The raw data is shown in the data files with P values (n = 3 biologically independent experiments; one-tailed paired t-tests). When we compute areas under the curve for 3 biological replicates, then SBI vs. SBI + MG in Cont iPSC-derived neurons p = 0.032; SBI vs SBI + MG in HTT125Q-derived neurons p = 0.073; SBI in Cont vs. HTT125Q-derived neurons p = 0.078; MG in Cont vs. HTT125Q-derived neurons p = 0.025; SBI + MG in Cont vs. HTT125Q-derived neurons p = 0.022 (one-tailed paired t-tests). Autophagy inhibition plus proteasome inhibition causes more cell death than each inhibition alone in HTT125Q-derived neurons compared to control iPSC-derived neurons. Source numerical data are available in source data.

