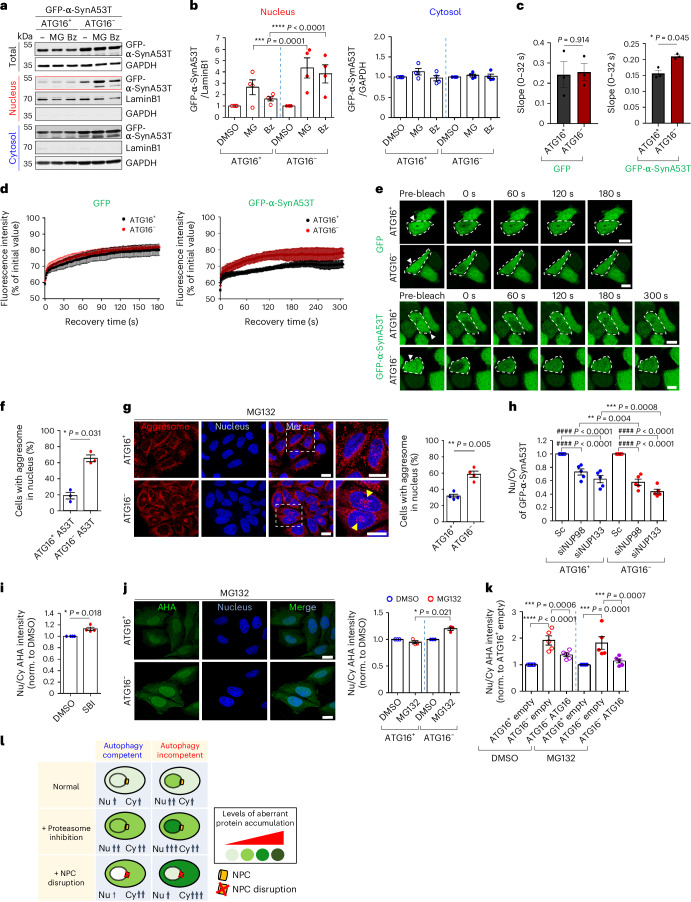
Fig. 2. Autophagy depletion causes nuclear translocation of erstwhile cytoplasmic autophagic substrates.
a, Autophagy substrate A53T α-Syn localized more in the nucleus of ATG16L1 KO (ATG16−) cells compared with ATG16L1 WT (ATG16+) cells treated with proteasome inhibitor (MG132 (MG, 10 μM, 6 h) or Bz (2 μM, 6 h)) by cell fractionation. b, Quantification of western blots (representative in a) showing relative changes of A53T α-Syn in nucleus and cytosol within cell lines caused by proteasome inhibitors (DMSO = 1) (n = 4 independent experiments; two-way ANOVA with post hoc Tukey test). c–e, Nuclear FRAP in ATG16L1 WT and KO cells expressing either GFP-empty or GFP-A53T α-Syn. The initial recovery slope (0–32 s) rate of d (n = 3 independent experiments; two-tailed paired t-test) (c). Nuclear FRAP curves show faster recovery of GFP-A53T α-Syn in ATG16L1 KO cells compared with WT cells, while this effect was not seen with GFP-empty (d). Representative images of ATG16L1 WT and KO cells expressing either GFP-empty or GFP-A53T α-Syn before and after photobleaching and after recovery (up to 3 min or 5 min) (e). Arrowhead indicates photobleached cell. Scale bar, 10 µm. f, Increased nuclear aggresomes by Proteostat dye in ATG16L1 WT and KO cells expressing A53T α-Syn treated with MG (n = 3 independent experiments; two-tailed paired t-test). g, Increased nuclear aggresomes in ATG16L1 KO compared with WT with MG (2 μM, 15 h) (n = 4 independent experiments; two-tailed paired t-test). Scale bar, 20 µm. h, Knockdown of NUP98 or NUP133 inhibits A53T α-Syn shuttling into nucleus in ATG16L1 KO cells compared with WT cells, by immunostaining (n = 5 independent experiments; two-way ANOVA with post hoc Tukey test). i,j, Localization of AHA-labelled proteins by immunostaining upon either autophagy inhibition with SBI (5 µM, 15 h) in HeLa (i) (n = 4) or proteasome inhibition (MG, 2 µM, 15 h) in ATG16L1 WT and KO cells (j) (n = 3 independent experiments; two-tailed paired t-test). Scale bar, 20 µm. k, Overexpression of ATG16L1 rescues mislocalization of AHA-labelled proteins in ATG16L1 KO cells by western blotting (n = 5 independent experiments; one-way ANOVA with post hoc Tukey test). l, Schematic representation shows idealized protein levels/localization upon proteasome inhibition or NPC disruption in WT and autophagy-null cells. Values are mean ± s.e.m. Source numerical data and unprocessed blots are available in source data. DMSO, dimethylsulfoxide.

