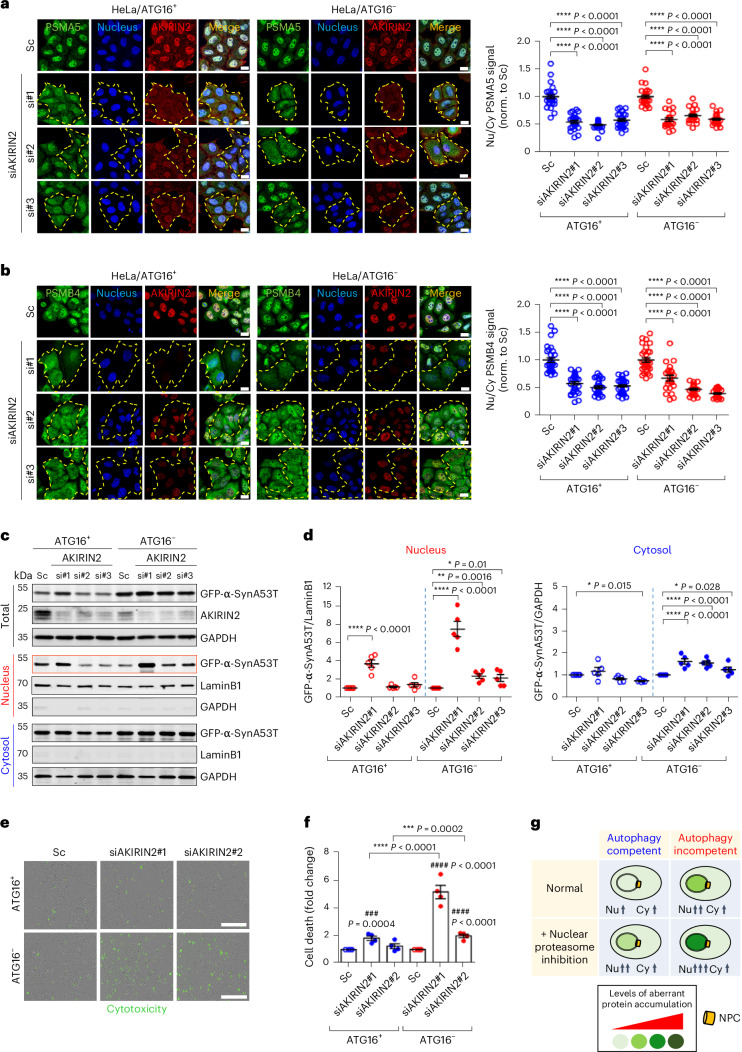
Fig. 3. Loss of AKIRIN2 decreases nuclear proteasome-mediated protein degradation in autophagy-deficient cells.
a,b, Knockdown of AKIRIN2 with distinct siRNAs inhibits nuclear localization of proteasome subunits PSMA5 (a) and PSMB4 (b). Cells were transfected with AKIRIN2 siRNAs (#1, #2 and #3) for 5 days in ATG16L1 WT and -null cells. Cells were fixed and labelled for endogenous AKIRIN (red), DAPI (nucleus, blue) and either PSMA5 (green, a) or PSMB4 (green, b). Quantification of nucleus/cytosol-localized proteasome subunit (PSMA5 (a), PSMB4 (b) (~n = 30 cells in each condition with three different siRNA oligonucleotides; ****P < 0.0001 versus DMSO; one-way ANOVA with post hoc Dunnett test) – single experiment to validate published results28 (right). Yellow dashes in a and b outline AKIRIN2-knockdown cells. Scale bar, 20 μm. c,d, Knockdown of AKIRIN2 with distinct siRNAs (si#1, si#2 and si#3) inhibits A53T α-Syn degradation in the nucleus assessed by cell fractionation (day 3). Nuclear A53T α-Syn accumulated in ATG16L1 KO (ATG16−) cells after AKIRIN2 knockdown (c). Relative changes of GFP-A53T α-Syn levels in nucleus and cytosol within each cell line after AKIRIN2 knockdown (scramble (Sc) = 1) (n = 5 independent experiments; *P < 0.05, **P < 0.01, ****P < 0.0001 versus Sc; one-way ANOVA with post hoc Dunnett test) (d). e, Knockdown of AKIRIN2 enhances cytotoxicity (green fluorescence) in ATG16L1 KO cells measured by Incucyte live-cell imaging. Scale bar, 600 μm. f, Quantification of CellTox Green fluorescence intensity after knockdown of AKIRIN2 (day 5) (n = 4 independent experiments; ###P < 0.001, ####P < 0.0001 versus Sc; ***P < 0.001, ****P < 0.0001 for relative changes induced by specific siRNA in WT versus KO cells; two-way ANOVA with post hoc Tukey test). g, Schematic representation shows idealized protein levels/localization upon nuclear proteasome inhibition in WT and autophagy-null cells. Data used for two-way ANOVA derived control values as the sum of all data from that experiment, where controls were originally normalized to 1 (as shown in the graphs), divided by the number of conditions analysed (see Methods). Data analysed by one-way ANOVA, where ATG16+ and ATG16− data were not compared, were analysed separately. Values are mean ± s.e.m. Source numerical data and unprocessed blots are available in source data. DAPI, 4,6-diamidino-2-phenylindole.

