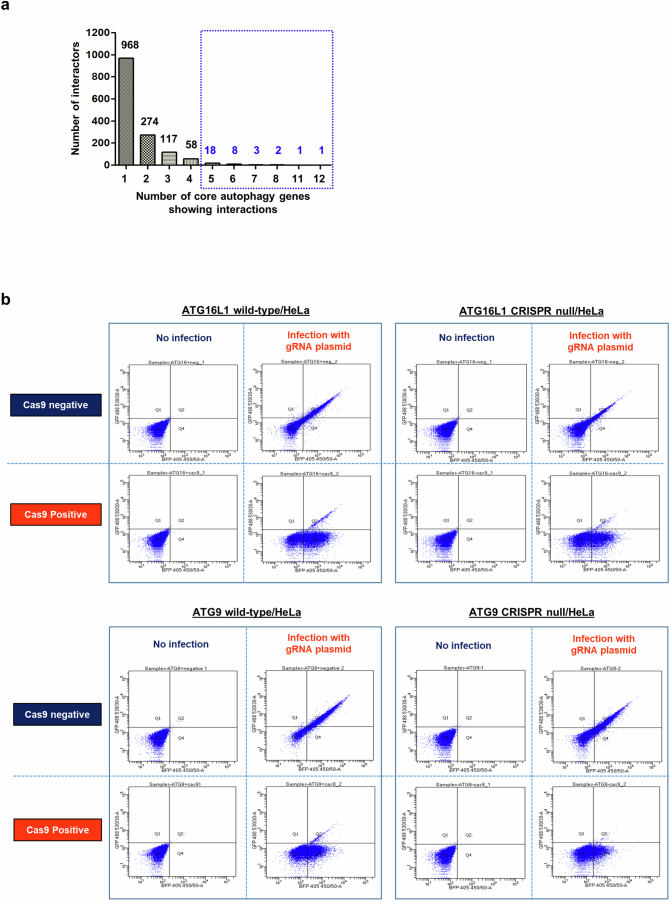
Extended Data Fig. 1. Synthetic lethality CRISPR/Cas9 screen.
a, Numbers of human orthologues of yeast genes with negative genetic (NG) or synthetic lethal (SL) interactions with core autophagy genes, identified using databases (genetic interactions from YeastMine and human orthologues from HGCN) in silico. Number of core autophagy genes showing negative genetic/synthetic lethal interactions with specific genes is shown on x axis. b, Establishment of Cas9 stable lines in both HeLa/ATG16L1 WT and ATG16L1 KO (upper panel) and HeLa/ATG9 WT and ATG9 KO (lower panel) cells. Cells stably expressing Cas9 plasmid were selected. Cas9 enzyme cutting efficiency after gRNA plasmid infection was measured by FACS (flow cytometer) in ATG16L1 WT and KO (upper panel) and in ATG9 WT and KO (lower panel). Cas9 stable cell line (the pool) was assessed for Cas9 cutting efficiency with a lentiviral vector encoding BFP, GFP and a sgRNA against GFP. The percentage of BFP + /GFP- (edited) to BFP + /GFP+ (total transduced) cells was analysed in Cas9-negative and Cas9-positive cells by flow cytometer. (x axis shows BFP fluorescence, y-axis shows GFP fluorescence; Q1 (BFP-/ GFP+), Q2 (BFP + /GFP+), Q3 (BFP-/GFP-), and Q4 (BFP + /GFP-)). Source numerical data are available in source data.

