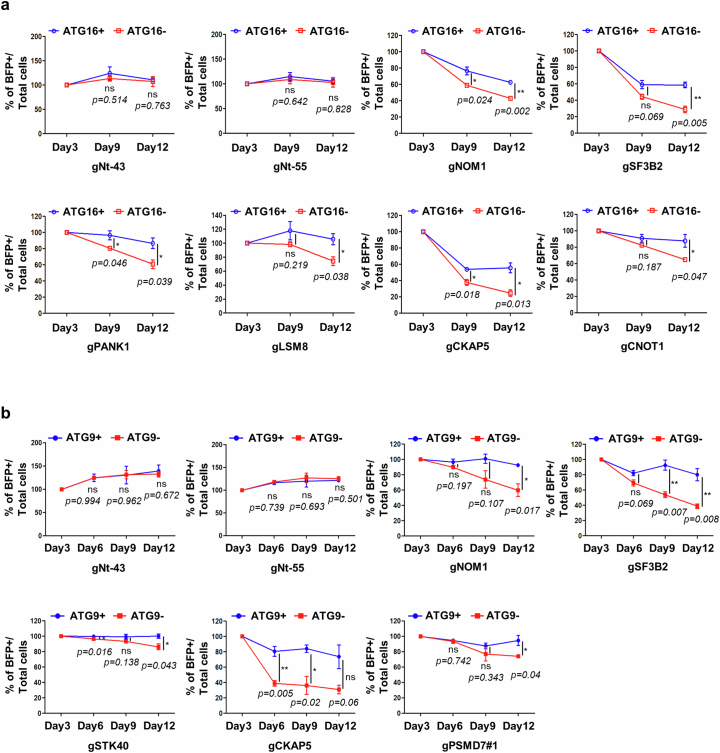
Extended Data Fig. 2. Results of synthetic lethality CRISPR/Cas9 screen in either autophagy-competent or -incompetent cells.
a, b, Potential candidates from synthetic lethality (SL) CRISPR/Cas9 screen in ATG16L1 wild-type (WT) (ATG16+) and knockout (KO) (ATG16-) (a) and in ATG9 WT (ATG9+) and KO (ATG9-) cells (b) assessed at different time points after gRNA transduction. Two non-targeting gRNA sequences (gNt-43 and gNt-55) were employed as negative controls in the experiment. Values are mean ± S.E.M. (n = 3 technical triplicates after initial infected plates split into 3 plates of 96-well plate for ATG16L1 WT vs. KO cells and ATG9 WT vs. KO cells. % of BFP+ cells/total cells at 3 days (Day 3) set to 100 % in all conditions to allow us to determine relative loss of cells over time in autophagy-competent versus autophagy-incompetent cells; ns = not significant, * p < 0.05, ** p < 0.01; two-tailed unpaired t-test). Significantly decreased % of BFP+ cells indicating gRNA-infected cells (increased toxicity) in autophagy-null vs. WT cells indicates negative genetic/synthetic lethal interactions. Source numerical data are available in source data. LSM8 was only analysed in ATG16+ and ATG16- cells and was not pursued further in this study.

