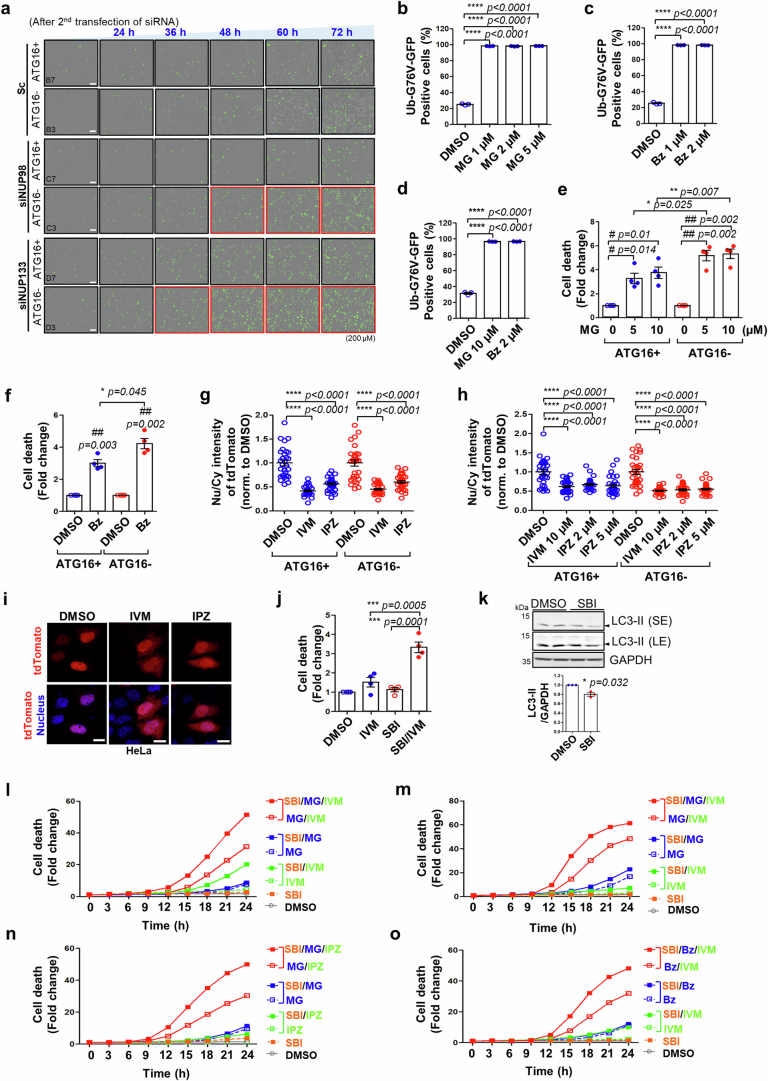
Extended Data Fig. 3. Autophagy inhibition enhances cell death upon proteasome inhibition and/or nuclear import inhibition.
a, Representative images showing the cell death measured CellTox Green by real-time Incucyte in HeLa/ATG16L1 wild-type (ATG16+) and null cells (ATG16-). Cells were double-transfected with siRNA against either Sc (Scrambled), NUP98 or NUP133, respectively, and stained with CellTox Green dye, then monitored by real-time Incucyte. Data in Day 5 (72 h after siRNA double transfection) is shown in Fig. 1f,g. Red boxes indicate times where there is synthetic lethality for the different siRNAs in ATG16-. Scale bar, 200 µm. b-d, Proteasome inhibitors (MG132 (MG) (b, d) and Bz (c, d)) inhibit proteasome activity measured by Ub-G76V-GFP, a ubiquitin fusion degradation (UFD) reporter, at different time points (b-c; 24 h and d; 6 h) and different concentrations in HeLa cells. (Value are mean ± S.E.M; n = 3 biological independent experiments; **** p < 0.0001 vs. DMSO; one-way ANOVA with post hoc Dunnett test) e, Effect of proteasome inhibitor MG132 (MG, for 24 h) on cell death measured by LDH assay in HeLa/ATG16L1 WT (ATG16+) and KO (ATG16-) cells. Values are mean ± S.E.M. (n = 4 independent experiments; # p < 0.05, ## p < 0.01 vs. DMSO; * p < 0.05, ** p < 0.01 for relative changes induced by MG in WT vs. KO cells; two-tailed paired t-test). f, Effect of proteasome inhibitor Bortezomib (Bz, 1 µM for 24 h) on cell death in ATG16L1 WT and KO. Cell death was detected by LDH assay. Values are mean ± S.E.M. (n = 4 independent experiments; ## p < 0.01 vs. DMSO; * p < 0.05 for relative changes induced by Bz in WT vs. KO cells; two-tailed paired t-test). g-i, HeLa cells were transfected with NLS–tdTomato-NES, a shuttling construct containing both an NLS and an NES fused to tdTomato (red). Cells were treated with nuclear import inhibitors (ivermectin (IVM) and importazole (IPZ)). (g and h) Quantification of ratio of nucleus/cytosol-localized tdTomato intensity in HeLa/ATG16L1 wild-type and null cells at different concentrations and the different time points (IVM 25 µM and IPZ 25 µM for 6 h (g); IVM 10 µM, IPZ 2, 5 µM for 15 h (h) – data from one control experiment to confirm that the nuclear import inhibitors indeed affect this process) (Values are mean ± S.E.M; n = 30 cells in each condition with different time points and different concentrations; **** p < 0.0001 vs. DMSO; one-way ANOVA with post hoc Dunnett test). i, Representative pictures showing that nuclear import inhibitors (IVM 25 µM and IPZ 25 µM for 6 h) cause mislocalization of the NLS–tdTomato-NES to the cytoplasm in HeLa cells. Scale bar, 20 μm. These nuclear import inhibitors clearly increased the cytoplasmic pool of the NLS–tdTomato-NES reporter in steady-state – the failure to induce complete nuclear exclusion is consistent with other studies using these compounds with other NLS-containing substrates14,55,56 but may also reflect incomplete activities of the inhibitors at these concentrations55,57 and/or the possibility of a weakly functional NES in this reporter construct. j, The effect of autophagy inhibition (SBI, 5 µM for 24 h) combined with nuclear import inhibition by ivermectin (IVM, 10 µM for 24 h) on cell death measured by CellTox Green in HeLa cells. Values are mean ± S.E.M. (n = 4 independent experiments; *** p < 0.001 for relative changes induced by SBI (autophagy inhibition) or IVM (nuclear import inhibition) vs. combined inhibition; one-way ANOVA with post hoc Dunnett test). k, Effect of autophagy/ULK1 inhibitor SBI-0206965 (SBI) on LC3-II levels which correlated with autophagosome numbers in HeLa cells. Quantified data represents autophagy inhibition by SBI on LC3-II level. Blots are representative of three biologically independent experiments. Values are mean ± S.E.M. (* p < 0.05 vs. DMSO; two-tailed paired t-test). l-o, Combined effect of autophagy inhibition with proteasome and/or nuclear import inhibition on cell death were measured by real-time cell death assay (CellTox Green) at 3 h intervals. HeLa cells were treated with indicated distinct inhibitors in growth media with CellTox Green dye for 24 h. Cell death were measured with CellTox Green fluorescence/total area by Incucyte live-cell imaging. (l) Autophagy inhibition (SBI, 5 µM), proteasome inhibition (MG132 (MG), 2 µM), nuclear import inhibition (Ivermectin (IVM), 10 µM). (m) Autophagy inhibition (SBI, 5 µM), proteasome inhibition (MG, 5 µM), nuclear import inhibition (IVM, 10 µM). (n) Autophagy inhibition (SBI, 5 µM), proteasome inhibition (MG, 5 µM), nuclear import inhibition (Importazole (IPZ), 5 µM). (o) Autophagy inhibition (SBI, 5 µM), proteasome inhibition (Bortezomib (Bz), 1 µM), nuclear import inhibition (IVM, 10 µM). Autophagy inhibition plus proteasome inhibitor and/or nuclear import inhibitor stimulates more cell death than each inhibition alone. Each graph of cell death represents same order of toxicity. Source numerical data and unprocessed blots are available in source data.

