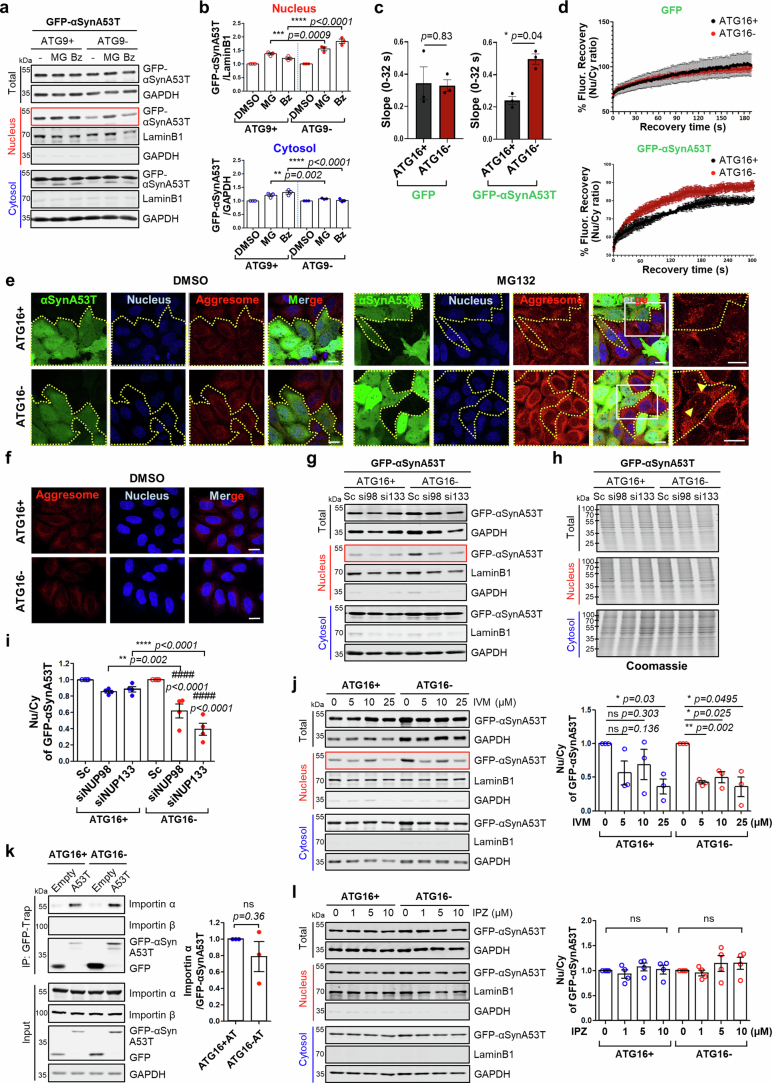
Extended Data Fig. 4. Autophagy inhibition causes autophagic substrate shuttling into the nucleus.
a, b, Autophagy substrate αSyn A53T localizes in the nucleus more in ATG9 KO (ATG9-) compared to WT (ATG9+) cells. Immunoblots for GFP-αSyn A53T localization in nucleus and cytosol fraction upon proteasome inhibition with MG132 (MG,10 µM) or bortezomib (Bz, 2 µM) for 6 h in ATG9 WT and KO (a). (b) Quantification of relative changes of A53T α-Syn in nucleus and cytosol within ATG9 WT and KO cells (DMSO = 1) induced by proteasome inhibitors. Values are mean ± S.E.M. (n = 3 independent experiments; ** p < 0.01, *** p < 0.001, **** p < 0.0001 for relative changes induced by proteasome inhibitors in WT vs. KO cells; two-way ANOVA with post hoc Tukey test). c, d, Nuclear fluorescence recovery after photobleaching (FRAP) in ATG16L1 WT and KO cells expressing either GFP-empty or GFP-A53T α-Syn. FRAP was measured by bleaching the entire nucleus and monitoring fluorescence recovery up to 3 min for GFP or 5 min for GFP-A53T α-Syn, respectively, in line with the nuclear fluorescence recovery kinetics of these different proteins shown in Fig. 2c–e. c and d, Nuclear FRAP was determined as the change in ratio of Nucleus/Cytosol fluorescence, respectively, in cells where we examined a region of interest of the nucleus that had been previously photobleached and a region of the cytoplasm that had not been photobleached. c, The rate showing the initial recovery slope (0–32 s) of d. Values are mean ± S.E.M. (n = 3 independent experiments; * p < 0.01; two-tailed paired t-test). d, Mean FRAP curves showing that the change in ratio of Nucleus/Cytosol fluorescence of GFP-A53T αSyn in ATG16L1 KO cells recovered faster than in WT cells, while this effect was not seen with GFP-empty. Values are mean ± S.E.M. (n = 3 independent experiments) e, Representative images show the effect of GFP-αSyn A53T on the number of nuclear-localized aggresomes upon proteasome inhibition described in Fig. 2f. Arrowhead indicates nuclear-localized aggresomes. Images are representative of three biologically independent experiments. Scale bar, 20 µm. f, Control data for Fig. 2g showing baseline aggresome staining in DMSO. Figure 2g shows MG132 effect. Images are representative of four biologically independent experiments in the condition of DMSO. Scale bar, 20 µm. g-i, Inhibition of nuclear pore complex (NPC) blocks autophagic substrate shuttling into nucleus more in ATG16L1 KO cells compared to WT cells. g, Representative immunoblots for i showing GFP-αSyn A53T mutant localization in nucleus or cytosol fraction upon either NUP98 (si98) or NUP133 (si133) knockdown in ATG16L1 WT and KO. Blots are representative of four biologically independent experiments. h, Knockdown of NUP98 and NUP133 on total protein levels in nucleus or cytosol fraction by Coomassie staining. i, Values are mean ± S.E.M. (n = 4 independent experiments; #### p < 0.0001 vs. Sc; ** p < 0.01, **** p < 0.0001 for relative changes induced by specific siRNA in ATG16L1 WT (blue dots) vs KO (red dots) cells; two-way ANOVA with post hoc Tuckey test). j, Representative immunoblots showing that for nuclear import inhibition by importin α/β inhibitor ivermectin (IVM) blocked αSyn A53T shuttling into the nucleus in ATG16L1 KO cells assessed by cell fractionation. (right panel) Quantified data represents the ratio of nuclear/cytosol-localized αSyn A53T. Values are mean ± S.E.M. (n = 3 independent experiments; ns = not significant, * p < 0.05, ** p < 0.01 vs. DMSO; two-tailed paired t-test). k, Representative blots showing the binding of αSyn A53T with importin α in ATG16L1 KO cells compared to WT. Cells were transfected with either GFP-empty or GFP-αSyn A53T and then immunoprecipitates obtained using GFP-trap were processed for immunoblotting to detect importin α and importin β. (right panel) Quantification shows the amount of importin α -bound GFP-αSyn A53T (Values are mean ± S.E.M; n = 3 biological independent experiments; ns = not significant ATG16+ vs. ATG16- cells overexpressing GFP-αSyn A53T (AT); two-tailed paired t-test). l, Representative immunoblots showing that nuclear import inhibition by importin β inhibitor importazole (IPZ) did not affect αSyn A53T shuttling into the nucleus in ATG16L1 KO cells assessed by cell fractionation. (right panel) Quantified data represents the ratio of nuclear/cytosol-localized αSyn A53T. Values are mean ± S.E.M. (n = 4 independent experiments; ns = not significant vs. DMSO; two-tailed paired t-test). Source numerical data and unprocessed blots are available in source data.

